Silvaire wrote:
Why do you think the annual cycle varies as it does so consistently, year after year? Do volcanos operate on a calendar basis?
Absolutely not! The way, however, gases that are emitted from volcanic activity is spread among the surface or lifted in higher parts of the atmosphere is very obviously cyclic on a calendar basis!
As a pilot you should actually know this: The colder the outside air temperature is and hence the bigger the temperature spread between hot volcanic gas emissions and the surrounding air, the faster these gasses are climbing into higher altitudes. The lower this spread is, the slower this ascend will be and the more of the gasses will mix in the air close to the surface.
Therefore it is to be expected, that in measurements close to the surface you find higher concentrations of the volcanic gases in hot months than in cold months.
Is your picture consistent with this model or not?
Malibuflyer wrote:
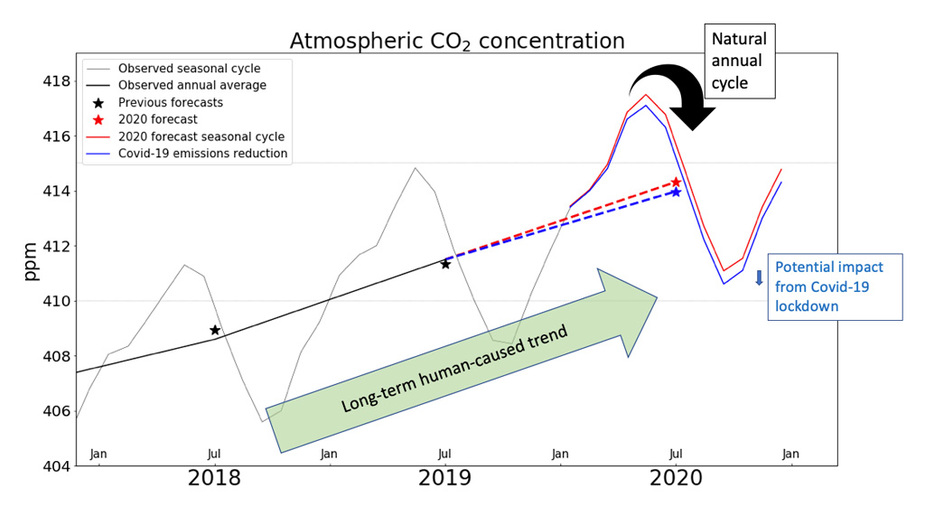
What the data shows (factually for those who know what facts are), that an unprecedented reduction of carbon emission has little measurable effect in a location 2500 miles away from the nearest sizable carbon production within a time frame of 2 months.
Yes, it does show that, except the time frame is three months and the reduction in man-made CO production is global, not localized. I think it is highly unlikely that CO2 levels would be completely unaffected after three months of ~25% GLOBAL reduction in man-made CO2, if man-made production is the dominant factor in producing this data.
Since the “issue” being imagined is that the data collection location is wrong, is there any other data gathered from another location that contradicts the NOAA data that actually does exist? Or should just wait for a year for Hawaii to catch up with the rest of the world in measured atmospheric CO2 reduction? 
Malibuflyer wrote:
Therefore it is to be expected, that in measurements close to the surface you find higher concentrations of the volcanic gases in hot months than in cold months.
The climate in Hawaii does not vary significantly by season, and the data collection point is on an 11,100 ft elevation mountain. My question about volcanos operating on a calendar basis was obviously meant to point out that the CO2 periodicity and data trends from Hawaii have nothing at all to do with volcanos.
Silvaire wrote:
Yes, it does show that, except the time frame is three months and the reduction in man-made CO production is global, not localized.
Absolutely not! There has not been any meaningful reduction of man made CO2 in a 2500 circle around the point where your measurement has been made at all!
Again, I’d like to see similar CO2 data by month, over a period of years, from any location in the world which contradicts the data that does actually exist, and supports the hypothesis that Mauna Loa is the wrong location on the earths surface to make this measurement.
NOAA says the annual variation is due to vegetation absorption.
Gases propagate according to the law of partial pressure, so eventually it will all even out.
@Silvaire:
Even better – you can see it even in the Mauna Loa data – just not in the one graph you choose to make up your own truth …
Malibuflyer wrote:
you choose to make up your own truth
Ah, well you can prove anything with “facts”.  H.Simpson, I think.
Malibu, you have my sympathy. Climate change discussion actually has many analogies with the anti-vax campaigns, and a Venn diagram will often include both data sets. Obviously there are climate change deniers and anti-vaxxers with genuine questions and interesting challenging viewpoints, but for the most part they are textbook examples of an entrenched position immune to modification by empirical facts. It’s vital that anti-vaxxers don’t deny the facts outright, as that would look unreasonable and that you’re uninterested in modifying your opinion. So instead the tactic is to ask for proof to 4 decimal places. Proof is accordingly supplied to 4 decimal places, but the response then is that proof is now needed to 9 decimal places. When this is answered with, ’I’m sorry but this just isn’t possible’, the stock response is ‘well then, that’s clearly no proof is it!‘. And so it all descends into a kind of "There’s a hole in my bucket":https://en.wikipedia.org/wiki/There%27s_a_Hole_in_My_Bucket time wasting and will-to-live nightmare of colossal proportions.
Eventually, of course, one would rather do something more fun, like cleaning out the shower plug hole, as you’ll find if you read back a few pages.
We saw the same in Covid. There is a big debate to be had on “what to do”, but for those who don’t want to do anything, the tendency is to debate “is it happening”, so everyone wastes energy on the wrong debate.
But when the “is it happening” debate is inevitably lost, these people have lost credibility and / or withdraw from the debate, so the “what to do” debate becomes quite one-sided in favour of the “doing a lot and sod the economic consequences” camp.
Which is a bit ironic, if they used their energy to get a sensible reaction (rather than eco-radicalism/perma-lockdown/whatever) instead of wasting it on ultimately futile denial, they would achieve more of what they want, which is (presumably) reasonable preservation of lifestyle and opportunity.
For example – the eco-warriors have convinced the general population that aviation is a huge contributor to global warming when in reality it is a rounding error, and if the energy had gone into getting a rational response instead of denial, that might not have happened.
Turning this around a bit… the first hypothesis was that Hawaii is too far from industrial CO2 production to respond in less than a year to a substantial reduction in man-made CO2. What then is producing the continuously upward trend in measured data from 2020 from 2019 – if it isn’t CO2 from remote man made sources? Is it local man-made sources that have somehow not been reduced?
I don’t think so. The data seems to me unrelated to man’s activity, just as the data on continuous sea level rise since 1880 or longer is not correlated in any way to industrial activity that didn’t increase much until about 1950.
@Cobalt, the purpose of what I’m writing here is a rational response to what I see as a completely irrational movement that likes to ignore facts and data and produce dotted lines to make the data fit the argument – which is mostly an argument against mankind’s continued well being, exactly as you say applies to those who are unconcerned with mankind’s overall being when promoting a draconian, totalitarian experimental approach to controlling infectious disease.
Ultimately what matters to me is mankind’s well being, with freedom being the most important element in that well being.
What I see in the Hawaii data itself is no change at all in either the annual or monthly data.
Silvaire wrote:
What then is producing the continuously upward trend from 2020 from 2019 – if it isn’t CO2 from remote man made sources? Is it local man-made sources?
Last year’s CO2 increase from remote man-made sources, perhaps?