An interesting case:
Just filed a flight plan with the Autorouter, for Monday, and the briefing pack shows this MSLP chart, T+96
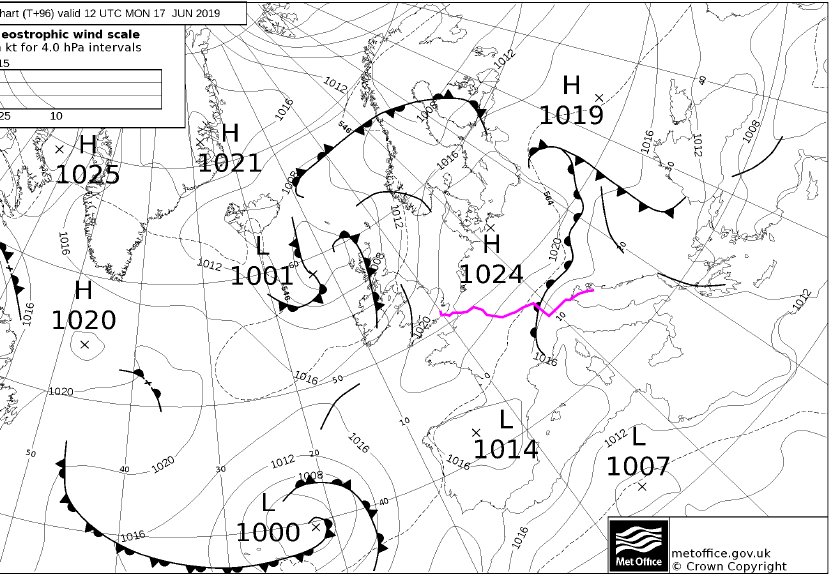
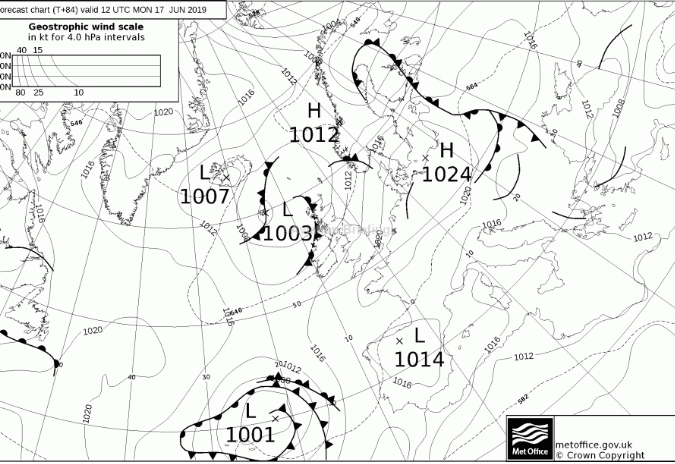
The current version is T+84 and how different it looks, for the route shown in magenta:
Michal wrote:
dublinpilot wrote:
I’ll write you a little app
is it somewhere already available? which platform?
It’s available now in the Google Play Store. It’s called MSLP Viewer. Nothing fancy at all, but it displays the current charts in the right order, and allows you to step forward and backwards through them.
I didn’t put it in the iOS store, as they charge $99 per annum, and I’d be flabbergasted if it made that back each year! At least the Google store was a once off cost!
Gosh, yes, it’s like one of those “can you tell the difference” pictures. There are different… ever so slightly.
Peter wrote:
I have just found something REALLY weird. Same chart, but one is marked by the UKMO as t+12 and the other one is marked t+24
But they’re clearly not the same chart. Look at the occluded front in the extreme south. Ot the position of the 1020 high. It just means that for 12 hours the forecast was pretty good.
I have just found something REALLY weird. Same chart, but one is marked by the UKMO as t+12 and the other one is marked t+24
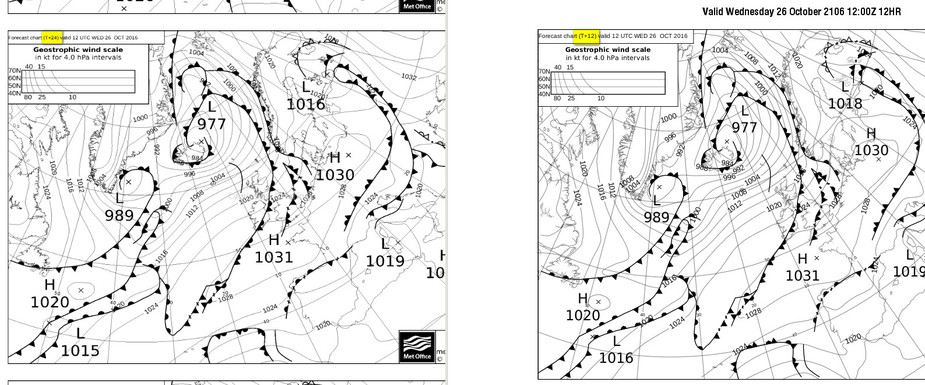
The first came from avbrief.com and the other from the UKMO.
To Colm: don’t rush, the season is almost done and to expect for/haze/low clouds there is no need for charts ;-) But keep us posted on development….
Hi Michal,
No it’s not available publically. I made it for Peter and myself. It’s very simple but I do like it so I’ll probably make it available publically. But before that I need to finish off a few things 
Colm
dublinpilot wrote:
I’ll write you a little app
is it somewhere already available? which platform?
I’ve been testing dublinpilot’s new app (which does work) and something curious has come to light…
As discussed previously, the charts which the UK Met Office (UKMO) chooses to publish on its website, and the UKMO charts which are available from the paid avbrief.com site, are the same where the UKMO does publish them but avbrief have some extra ones.
Specifically they have the 0600 and the 1800 and the T+120 one.
Firstly – the 0600 and the 1800, and the 1200 for the same day which fits between them, are all marked as T+24
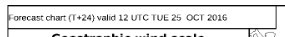
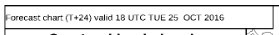
which suggests they were all generated at different times (i.e. at 0600 1200 1800 the previous day) but were they really? They don’t come out like that. The 0600 and 1800 come out at the same time.
Secondly – the T+120 (which the UKMO website doesn’t carry) is curious because if you look at that one, and the one immediately before it, you always see

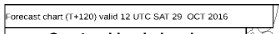
but the difference between T+84 and T+120 is 36hrs, not 24hrs  So the last one, T+120, is actually “older” than it seems, and was produced only 12hrs after the T+84 one. So it isn’t quite “fiction” but is clearly less reliable than it could be.
Does anyone know what is going on?
That weathercharts.org one is the one that I use all the time. It often shows out of date charts. Eg. the 36, 48 & 72 hours chart could all be for the exact same time. You really need to read the time to be sure.
When I’ve time, I’ll write you a little app that will show them 100% correctly for you. But to do it properly takes a lot of time, so it won’t be in the next few weeks ;)