Here a sample Lifted Index chart

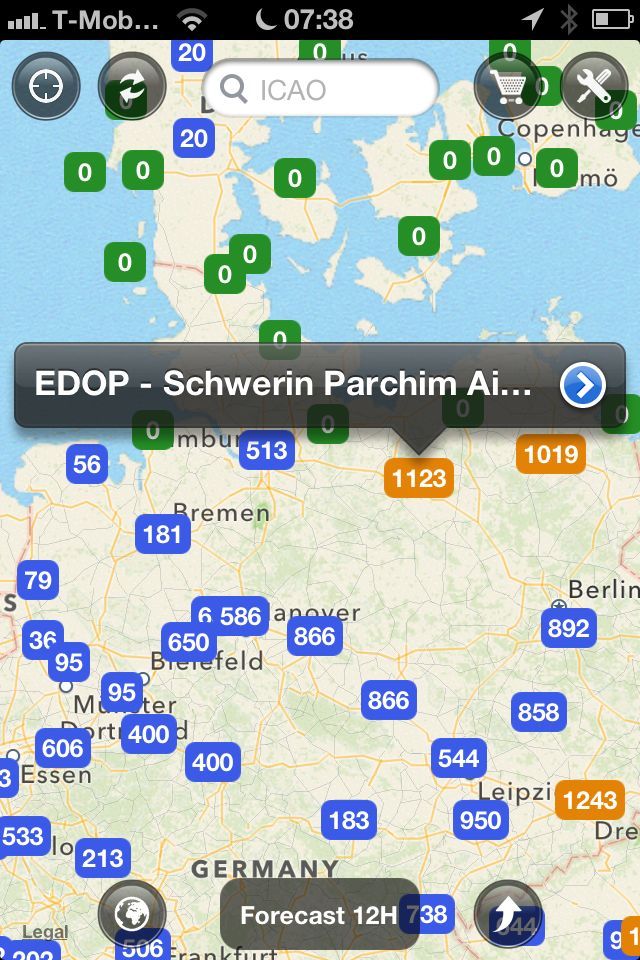
And here a CAPE value sample chart.
[edited to add a blank line before/after the graphic]
I've heard of those but have never met anybody using them. What are they and how would one use them, practically, to tell if a given layer of IMC will contain SLDs?
They have nothing to do with icing and all about convection. Lifted index is a stability index, Convectively Available Potential Energy is a measure of the energy a lifted air parcel can reach: high values can be indicative of thunderstorms. In an area with positive LI and no CAPE, the air will be flat. With negative LI and lots of CAPE, you'll be dodging CBs. They do not, in themselves, tell you exactly where you will find the TS, but for planning it's better to know than not.
Icing forecasts are similar: it's not about offering a guarantee, but rather about telling you where there is potential for significant icing.
That was vaguely what I understood, without knowing the application.
But... what does this give you which you don't get from
a trough depicted on the MSLP, indicating a PROB30 TEMPO TSRA, and such usually featuring in the TAF anyway
an IR image showing the usual ~FL300 cloud tops in a concentrated manner indicative of CB(s)
a sferics image showing lightning; either concentrated (a proper TS) or sporadic (dispersed TCUs/CBs)
The point is that if you see a clean IR and sferics image (which are trivial to pick up pre-flight) but the data suggests convective action, and at the airport of departure and all along the route it is wall to wall sunshine from SFC to outer space, and the MSLP is clean, will any data cause you scrap the flight?
You could sure get an air mass TS (or whatever you call the ones which just pop up out of nowhere, especially south of the Alps) but you can fly around them, or turn back, still in CAVOK conditions.
The problem is doing any of this in IMC, in which case is the risk of any CB acceptable?
I suppose this brings us to why all serious planes have radar...
what does this give you which you don't get from
Well it's the difference between a forecast and an actual, isn't it. These days, I find the GFS pretty good up to 3 days in advance. I find it useful.
One could have an abstract discussion about forecasts v. actuals but in the context of using wx data for flying, surely each method (apart from TAFs and METARs which separate the two formally) gives you a bit of each.
If you look out of the window at say 1200Z you are getting a bit of each. You are getting a METAR, and if you look at the 1200Z MSLP and find it is exactly the same (in the relevant region) as the 1800Z MSLP, then that look out of the window gave you a bit of a "forecast" too.
Each of the other methods gives you a bit of each, because the various bits of the jigsaw combine to make the bigger picture.
And obviously one never ignores an actual in favour of a forecast - that's a bit like the joke about "it may work in practice but will never work in theory". Short-term, an actual will always trump a forecast.
Or maybe my brain works in some weird way...
As you can see in the screenshots I have posted, the Lifted-Index and CAPE values shown there are from a 12 hour forecast (at the bottom of the screenshot it shows Forecast 12H).
If you are considering a flight e.g. tomorrow, then the CAPE and Lifted-Index info adds to the other information you already have such as significant weather charts that predict for that forecast period as well, next of course to the TAFs. The TAF values are given only for a few airports, while the CAPE and Lifted-Index can be applied everywhere, also in regions without many airports that can provide a TAF.
The numerical value of the Lifted Index gives you a good indication of whether the air is going to be potentially stable or unstable. A Lifted Index number of zero indicates air that is neutrally stable. Above zero indicates stable air, below zero indicates potentially unstable air. If the Lifted Index value is lower than -6, the airmass is potentially very unstable and could indicate a high possibility of Thunderstorm activity in that area. However, for Thunderstorm activity to happen, the airmass does not only need to be unstable, but also needs to include a lot of moisture amongst other factors, but a negative Lifted index number is a good first indication to watch out and check against other weather sources for potential weather hazards.
Short-term, an actual will always trump a forecast.
Yes, of course, exactly. So why pick on icing forecasts? Forecasts for convection and forecasts for low cloud/vis are also trumped by actuals.
So why pick on icing forecasts? Forecasts for convection and forecasts for low cloud/vis are also trumped by actuals.
Unfortunately there are no "actuals" for icing. In the US, you have a lot of PIREPs, in Europe those are rare.
Well, just set the Forecast 12H slider to Now and you get the Lifted Index and CAPE value for this moment, so kind of METAR for potential convective energy. The model will be quite accurate for short ranges in time, but the CAPE and Lifted Index values will still be based on the GFS data. Then move the slider and you will see how these values change over time. That is added value if you are about to go and fly for a 3 hour stretch. But then again, combine this information with other data such as TAF and significant weather charts and SAT images.