
Peter wrote:
The engine sounds like it is working harder but that seems just subjective; after a few mins you get used to it
Just sounds like you expected something different? All the numbers from the engine test stand they have at GAMI point in the direction that it’s just fine.
It’s another leap from 2200 to 2000 I can tell you. And I’m still puzzling about whether to go further down, because it feels so contrary to what’s been taught.
@UdoR the Lycoming -540 may be tolerant of cruise RPM at 2000 or even 1900, however this Continental SB suggests these large volume engines may need to be operated around 2300 or 2450 RPM.
Just to add some further input here, I found one quote which represents more or less what I do believe since long time (however a bit simplified in the quote):
“Here’s how an engineer who designs engines put it to me when I asked him about duty ratings: “It’s like this, the engine is good for XXXXX gallons of fuel, put it through there in a 1000 hrs or 10,000, you’ll be due to go through the engine.”
Found that quote in the Pilots of America forum:
https://www.pilotsofamerica.com/community/threads/how-to-decide-mp-and-rpm-settings.78410/
From the “Plane & Pilot Mag” it can be read:
“Lower rpm cruise has a number of benefits in addition to the obvious one of reduced noise level. Running a higher MP/lower rpm helps marry piston rings to the cylinder walls, resulting in better cylinder compression. It also reduces frictional losses and improves prop efficiency at lower rotational velocities. Additionally, it allows the valves to run cooler and normally results in lower EGTs and TITs.”
From here: https://www.planeandpilotmag.com/article/understanding-rpm/
There is an overall limiting factor here however, for non-turbo engines: very few people do long low level VFR trips, and at European IFR altitudes one is at wide open throttle (WOT) so no scope for MP control, and the mixture is equally predetermined by the need to be at best-SFC (best fuel flow per HP) which is slightly lean of peak EGT… or even more lean.
So the only thing you have to play with is RPM.
And having set the RPM to the desired number you then tweak the mixture for “slightly LOP” as desired.
If you have a turbo then this all gets modified.
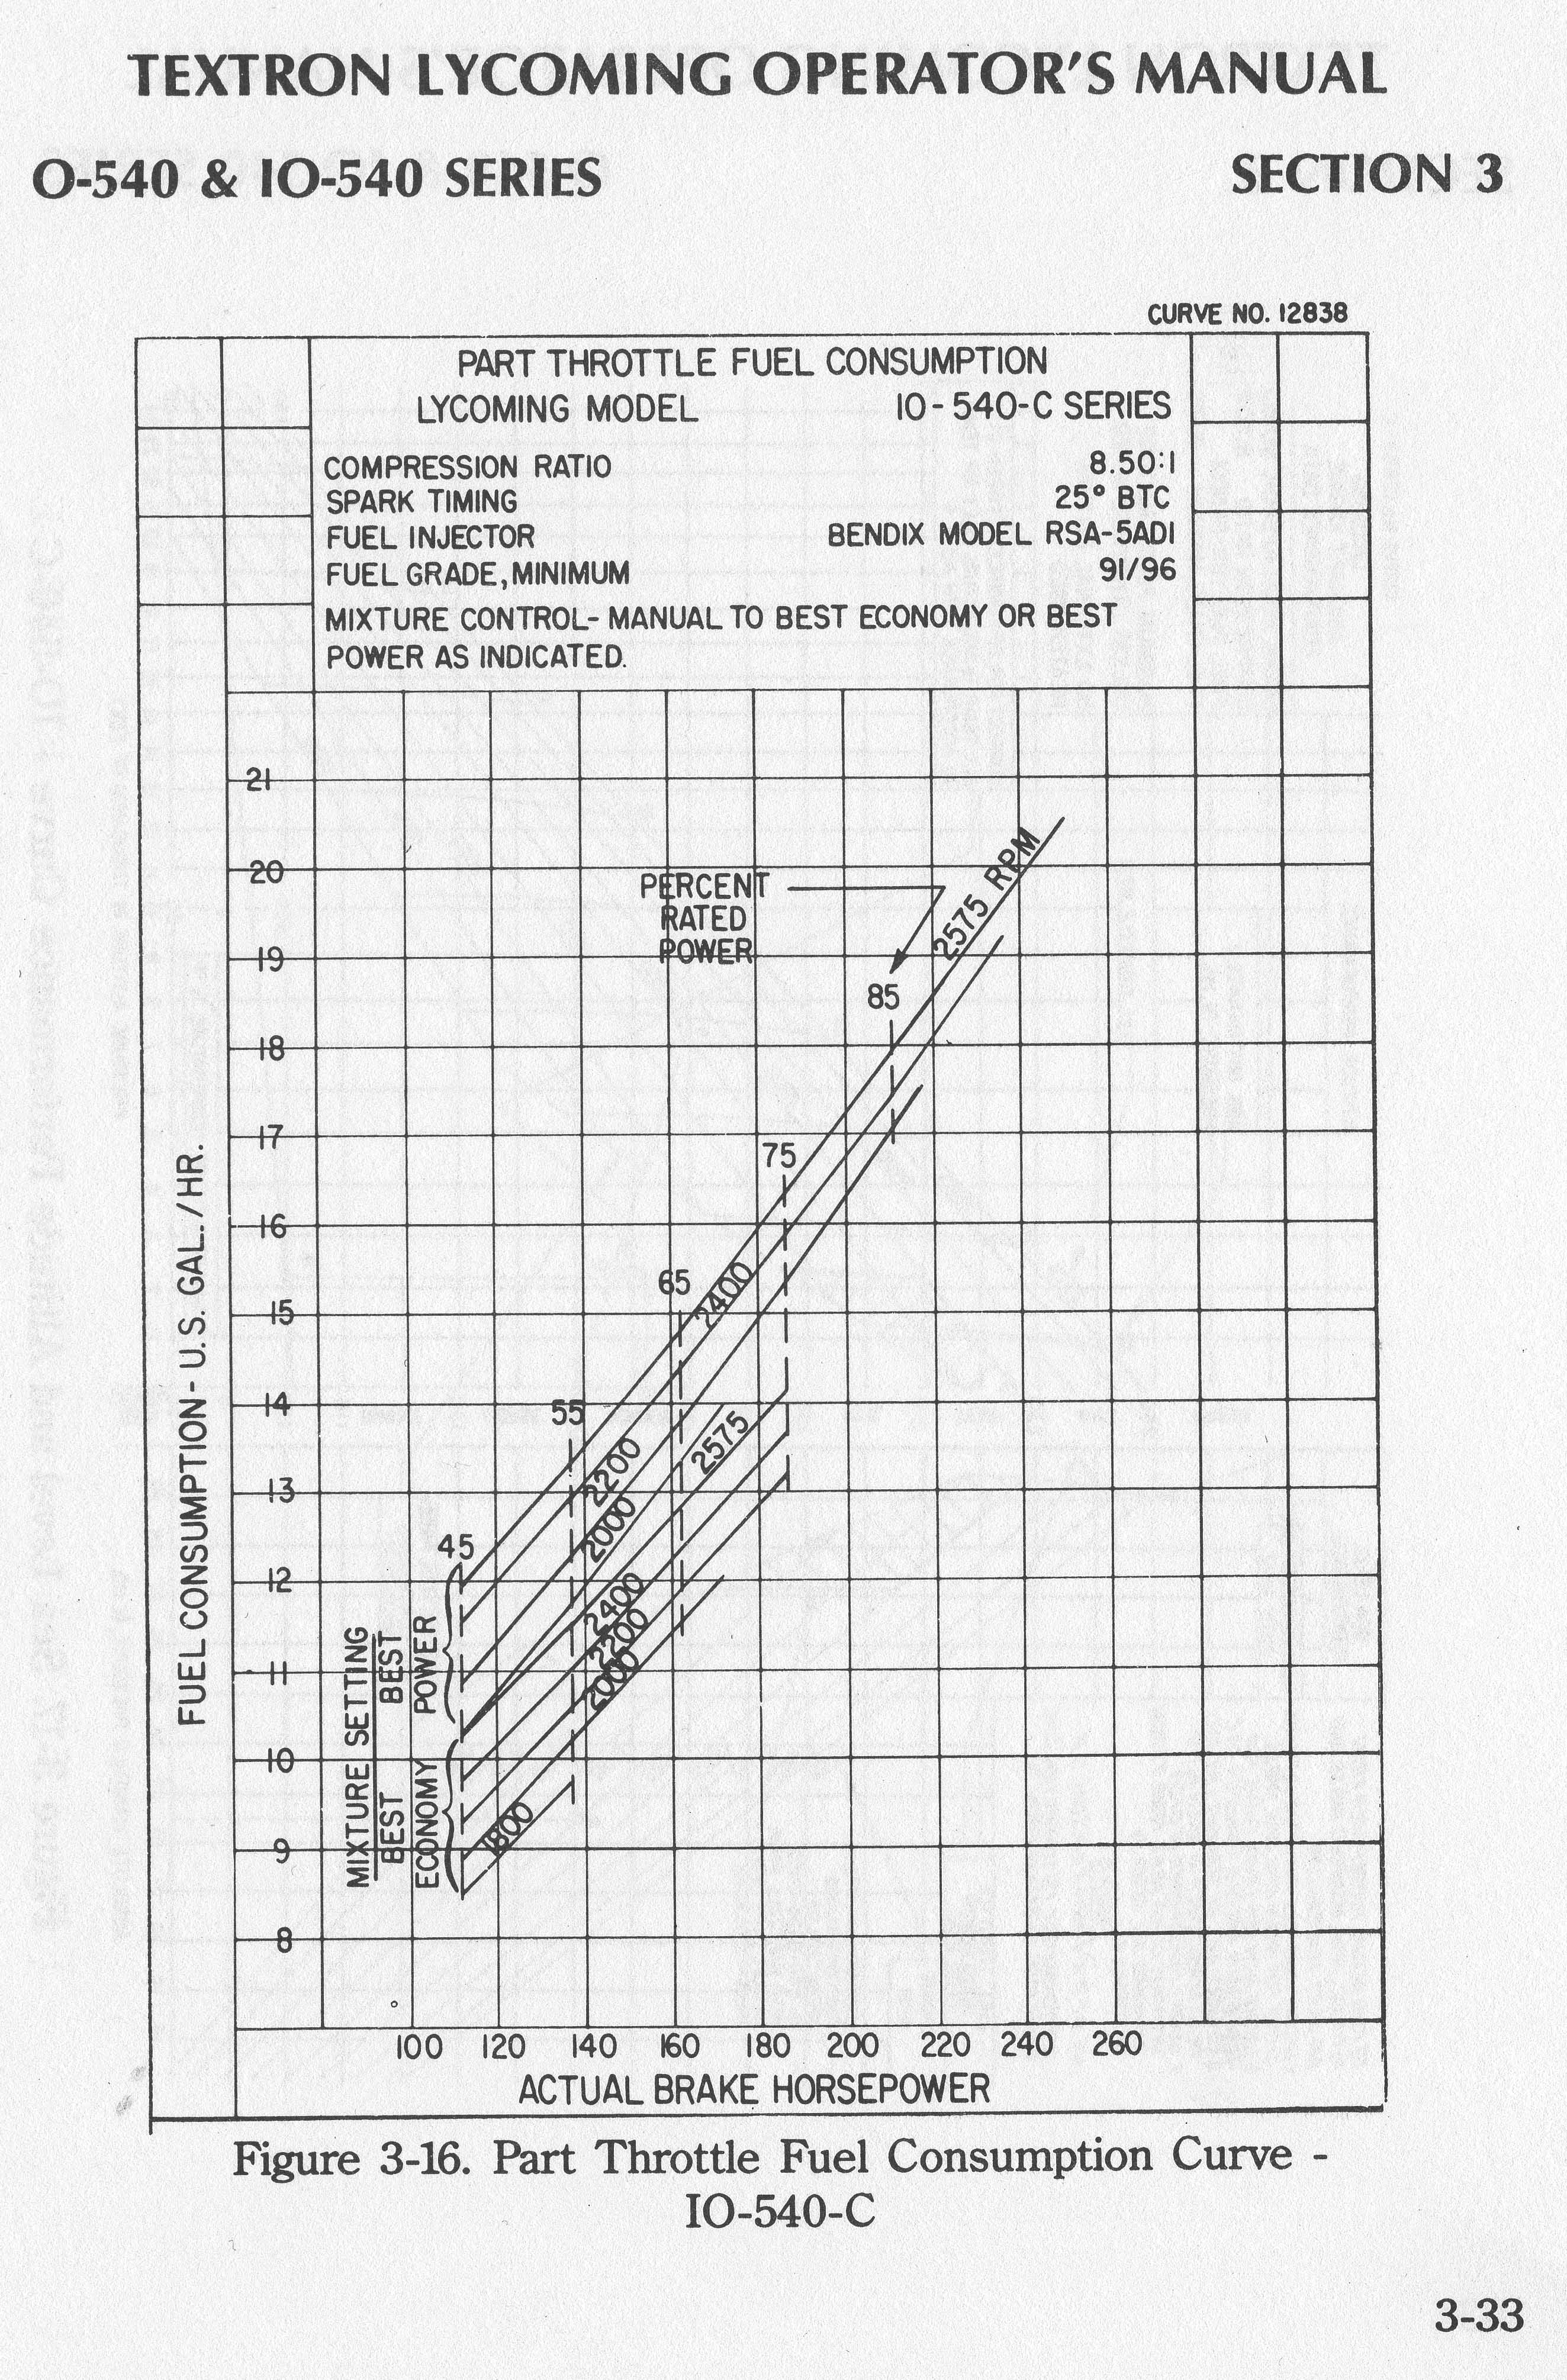
As for the original question, I am sure a lot of factors are at play as many of you suggest, but Lycoming tells you in every engine manual, what influence RPM officially has on FF, both best power and best economy mixtures.
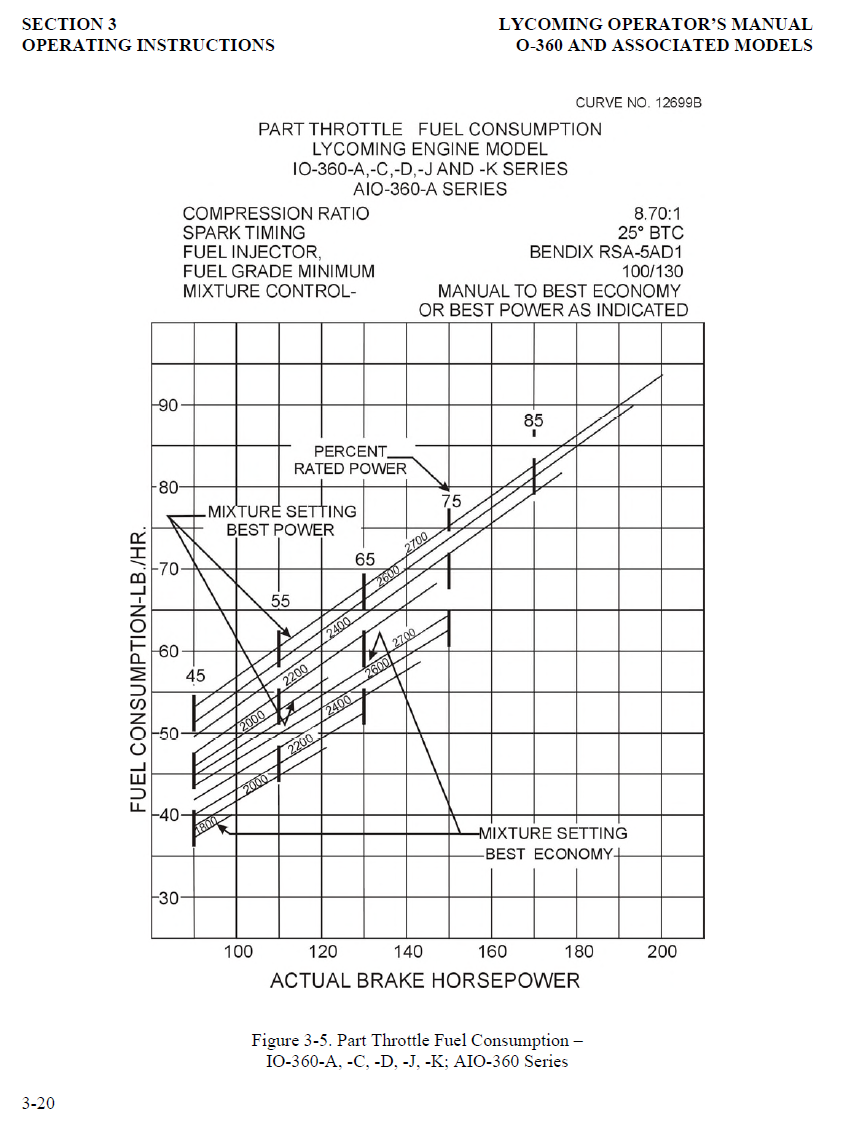
That’s interesting 
At 2200 and 2600, I make that 52 v. 56 lb/hr for 130HP, which is a 7.5% fuel flow difference. That’s in the right ballpark allright.
Read the manual? Who would have thought of that?
For my IO540 I make it 12.9 v. 13.8 USG/hr for 180HP which is 7%; also in the right ballpark.
BTW I believe what Lyco calls “best economy” is peak-EGT.
Next you’ll be thinking about two engines, with one operating at zero RPM for long range cruise 
Interesting discussion indeed!
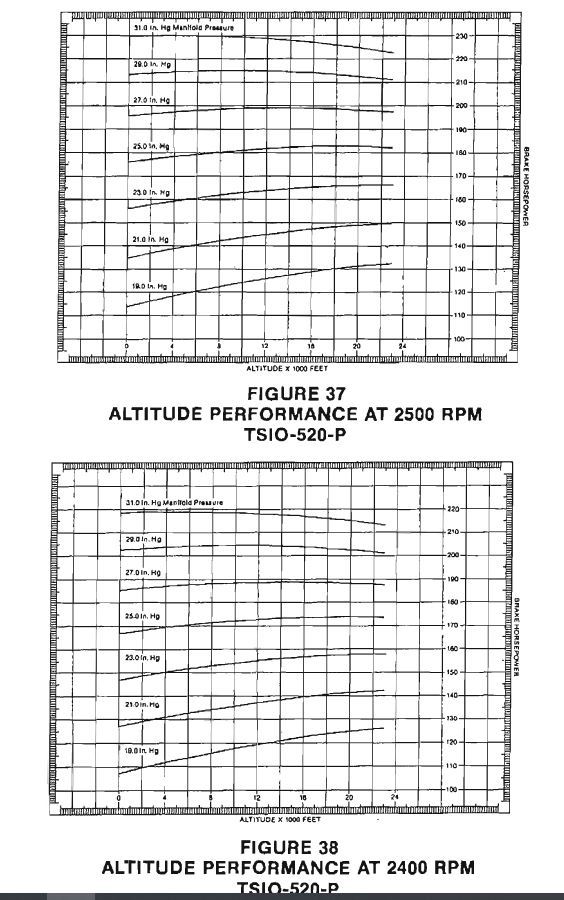
The contisaurus operating manual for our turboed TSIO-520P engine has a direct sea-level graph for specific fuel consumption (BSFC in pounds of fuel per hour per BHP).

It does show a linear correlation between RPM and BSFC (.565 vs .60 pph/bhp) at max continuous power (at 2600 vs 2200 RPM). Yes, the relationship is inverse (less efficient with fewer RPM) since I guess turbocharging plays a role: (ie, you need to close the wastegate to maintain such high manifold pressure at low RPM, whereas at high RPM the turbine is mostly bypassed resembling a conventional open exhaust)
Although I am sure they tested this on a test cell, we have to take it with a pinch of salt since it is assuming max continuous 35.5" MP is used at all RPMs ( see MAX CONTINUOUS ADMP at the top of the graph), but this is disadvised at less than 2600rpm !
Perhaps more realistic is the propeller load (P.L.) static graphs, where the conventional C.S. propeller (assume fine pitch, non-governed) is used to select a certain RPM on a static engine/aircraft. The corresponding MP is the P.L ADMP, with corresponding P.L. BSFC on the lowest graph. You can now see maximum efficiency (.54pph/bhp) at 2200RPM at about 28" MP (this one is kind of acceptable) and .565 at 2600RPM, or about 5% worse. This is probably factoring different propeller efficiency too, but supports lower RPM more evidently.
The obvious issue with the above is that it is only a static graph (ie non-moving airplane) , which probably makes it less applicable to our comparison.
Another issues is most likely this is all with full rich mixture.
[edited to correct the decimal point in the BSFC figures)
Our manual has no altitude fuel-consumption graphs, only power vs RPM and MP at different altitudes. You can however see that the turbo system makes for all kinds of changes at different altitudes where for example:
-At low MP (ie low turbocharging) power increases with altitude with the same MP (lower exhaust back pressure ? )
-At high MP, (ie high turbocharging ) power decreases with altitude with the same MP (more turbocharging required= higher exhaust back pressure ? )
In practice, ROP, you set MP and RPM and leave it unchanged in the climb up to a limit
LOP I use the generic formula with FF which is independent of RPM (giving a constant .42 PPH/BHP) or 22% better than any of the above ROP graphs at any RPM
Antonio, I find these graphs quite interesting, as I do not have any comparative graph for my plane. Constant MP leads to higher output power with increasing altitude, which is an effect of the decreasing temperature with altitude, where same MP puts more air mass into the cylinders.
In the end, power delivery of the engine is a matter of air mass, rather than MP.
The fact that with high power settings the power does not increase with constant MP should be due to the increasing air intake temperature. This, in turn, is a result of higher compression from the turbocharger. So the curve should depend a lot from whether an intercooler is installed or not.
I’d love to have such a graph for my engine.
Peter wrote:
Read the manual? Who would have thought of that?
I also have these graphs for my io-540 and just assumed that everybody would know these, which is why I didn’t post it here. But, yes, this is in all Lycoming Manuals and there exists an easy accessible document on the Lycoming Homepage including all these graphs for all Lycoming piston engines.
From the graph above for 55% HP and 2700 RPM you get 52 lb/h, whereas same power output and 2000 RPM results in 44 lb/h.
And yes, you’re right, that economy cruise for Lycoming is typically indicated as peak EGT.


