Looking at a hypothetical flight today, from Stanstead (EGSS) to Norwich (EGSH), and comparing the Skew-T charts for these airports
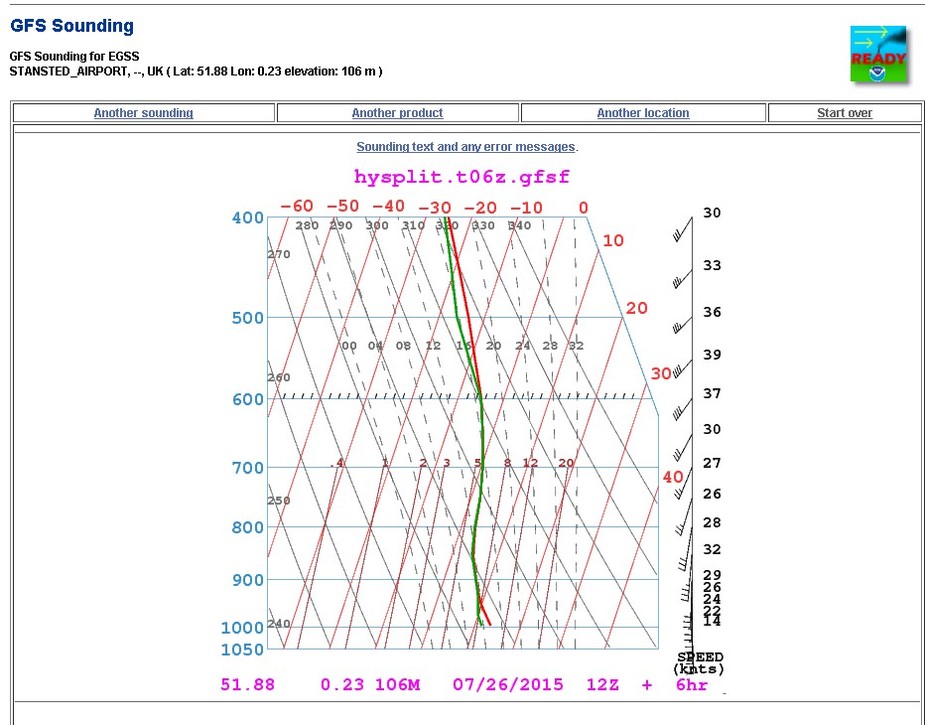
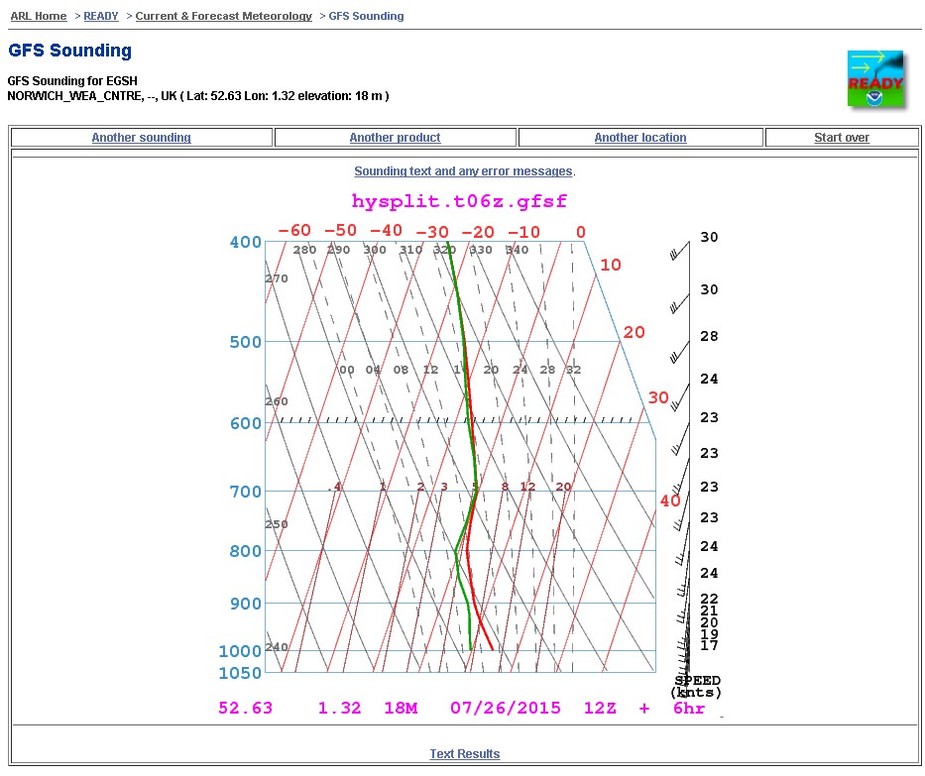
you can see the prediction of cloud up to over 14,000ft
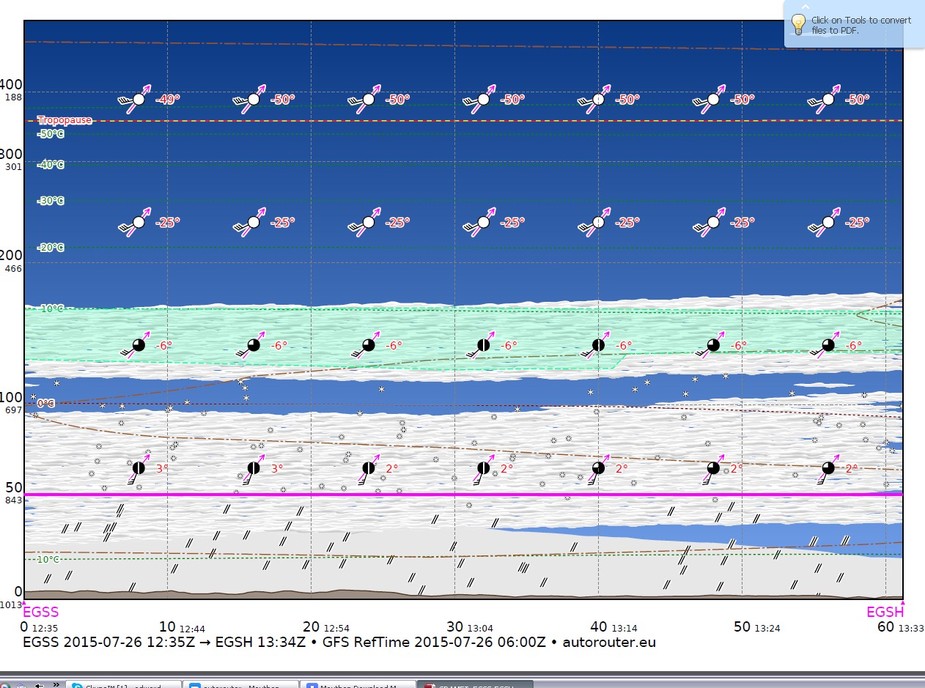
What I can’t figure is the OGIMET chart which follows, and gives a different impression.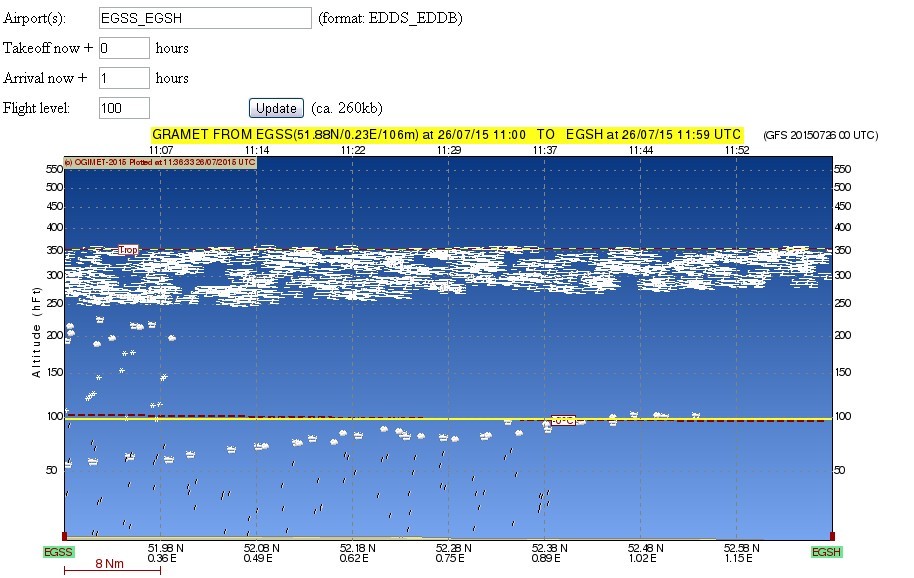
The first three images are what I would expect from the forecasts and looking out of the window, but I would like to know why OGIMET is so different.
Any Ideas?
Different datasets is one reason (OGIMET 20150726 00 UTC, autorouter 0600Z). Also the OGIMET plot is 90 min later.
Apart from that I have observed many overly optimistic depictions by OGIMET that I could not explain with the GFS data. One of the reasons we created our own implementation.
Like Achim says, Ogimet seems to be overly optimistic when it comes to clouds. Strangely enough, sometimes the cloud predictions are very similar. I am using Autorouter to be on the safe side. Also, I like its depiction of the Lifting Index to indicate a risk of possible forming CB’s which Ogimet lacks. The only thing which I find a little handier on Ogimet is that it indicates a numerical indication of head/tailwinds.
And don’t count on this nice layer just above FL100 in the Autorouter forecast above. It could be there, but just as easily could not..
aart wrote:
And don’t count on this nice layer just above FL100 in the Autorouter forecast above. It could be there, but just as easily could not..
Judging from the Skew-T:s, I would say not.
The skew-t diagrams are however generated from the same 3D wx model – GFS. Everything comes from the same place and everything is just another window on the same data 
There is a peculiarity of GFS in the way cloud data is delivered in the model. It separates clouds into low, medium and high. This does have a basis in physics in that these three cloud types are generated by mostly different mechanisms. Anyone who has done the JAA/EASA IR or CPL ground school will remember this stuff, but in the real world it is a generalisation and often gives the impression that the clouds will be in layers, with VMC in between.
The part which (for us in light GA) is most reliable is the high level cloud which AFAIK is nearly always cirrus (frozen ice particles) but this stuff never bothers us because it is around FL300 What bothers us is the low and medium cloud and the bases and tops of those are almost impossible to forecast.
At least that’s my understanding… There is a guy here with a PhD in atmospheric physics but he doesn’t usually say much
The difference between ambient temperature versus dewpoint temperature can give you a very rough indication of the possibility of clouds forming. The type of clouds might be deduced from the lifted index or CAPE value. In any case, I would have a second look at the infrared cloudtop temp satellite charts. The combined information could give you a rough indication of where to expect the top of clouds, but then again based on GFS model information. And Peter: don’t you have a perfect blogpost somewhere yourself where you explain this stuff?
I have a couple of articles here and here
Both probably need updating (dead links) but are otherwise OK.
But, even if you could get exact cloud tops, a lot of the time this is not what one is looking for because if e.g. you have a TB20 and the tops are showing at FL300 (as determined by the shade of grey and the corresponding temperature chart) are you going to cancel the flight? It could be just a cirrus layer.
Peter: your articles have at that time inspired me to develop the AeroPlus Aviation Weather app. Thanks for that inspiration you gave me!
By the way: what I do is look at the difference between the dewpoint temp and the ambient temperature all the way up to e.g. FL300 and how close the 2 are together. If they are sitting next to each other all the way up, then I would assume that there will not be that much layered. If the dewpoint temp and ambient temperature merge together and then divert from each other to merge again, I would look at the lifted index, the infrared cloudtop temp chart and think about possible layers where I can fly in between the cloud layers. This is often true but no guarantee of course. I could theoretically get a cirrus cloud layer where the temperature in the cloud layer is lower than -20 degrees Celsius: then I could fly in it and have a low possibility of ice. However, I would still not like to fly enroute in the clouds that long.
Always glad to inspire people
However -
Firstly, cirrus won’t be at -20C, IMHO. More like -50C.
Secondly, -20C is no assurance of a lack of icing in IMC. Lack of airframe icing, sure, but not a lack of fuel servo icing in engine installations where the cross-sectional area of the air intake is bigger than the cross-sectional area of the RSA fuel servo inlet (approx 6cm diameter) and where you thus get significant compression heating which takes the 100% RH air from -20C to say -5C. I am damn sure the TB20 gets this around -15C but it remains to be proven experimentally, with an instrumented aircraft.
Thirdly, the GFS skew-t plots are just forecasts, from the GFS model. If they were accurate, the atmosphere would have no secrets and forecasting would be perfect
Peter wrote:
There is a guy here with a PhD in atmospheric physics but he doesn’t usually say much 
If you mean me, nope, my PhD is in something much less applied. I only started working on the atmosphere after I got the IR (one of the nice things about the IR is that my life got a lot better after I got my IR, in various ways). But there’s at least one more of us atmospheric types around, with an actual atmospheric science PhD, so you must have meant meant him.
Peter wrote:
There is a peculiarity of GFS in the way cloud data is delivered in the model. It separates clouds into low, medium and high.
GFS actually gives you a cloud fraction for each of its vertical layers (of which there are ~60). The high, low, medium is just a useful shorthand if you don’t care about all 60 layers. The GRAMET representation actually uses the individual layers, unless I read the documentation wrong.
Peter wrote:
What bothers us is the low and medium cloud and the bases and tops of those are almost impossible to forecast.
GFS has a new boundary layer scheme (since January) that is state-of-the-art. This should have a big effect on low-cloud tops, which is one of the big issues for light GA (is it above the freezing level?). “State-of-the-art” doesn’t mean it will be perfect.