Today I found this chart on the dwd weather site.
As I haven’t recognised it before, what for is its use in terms of flight planning? How do you interpret it?
eddsPeter wrote:
How do you interpret it?
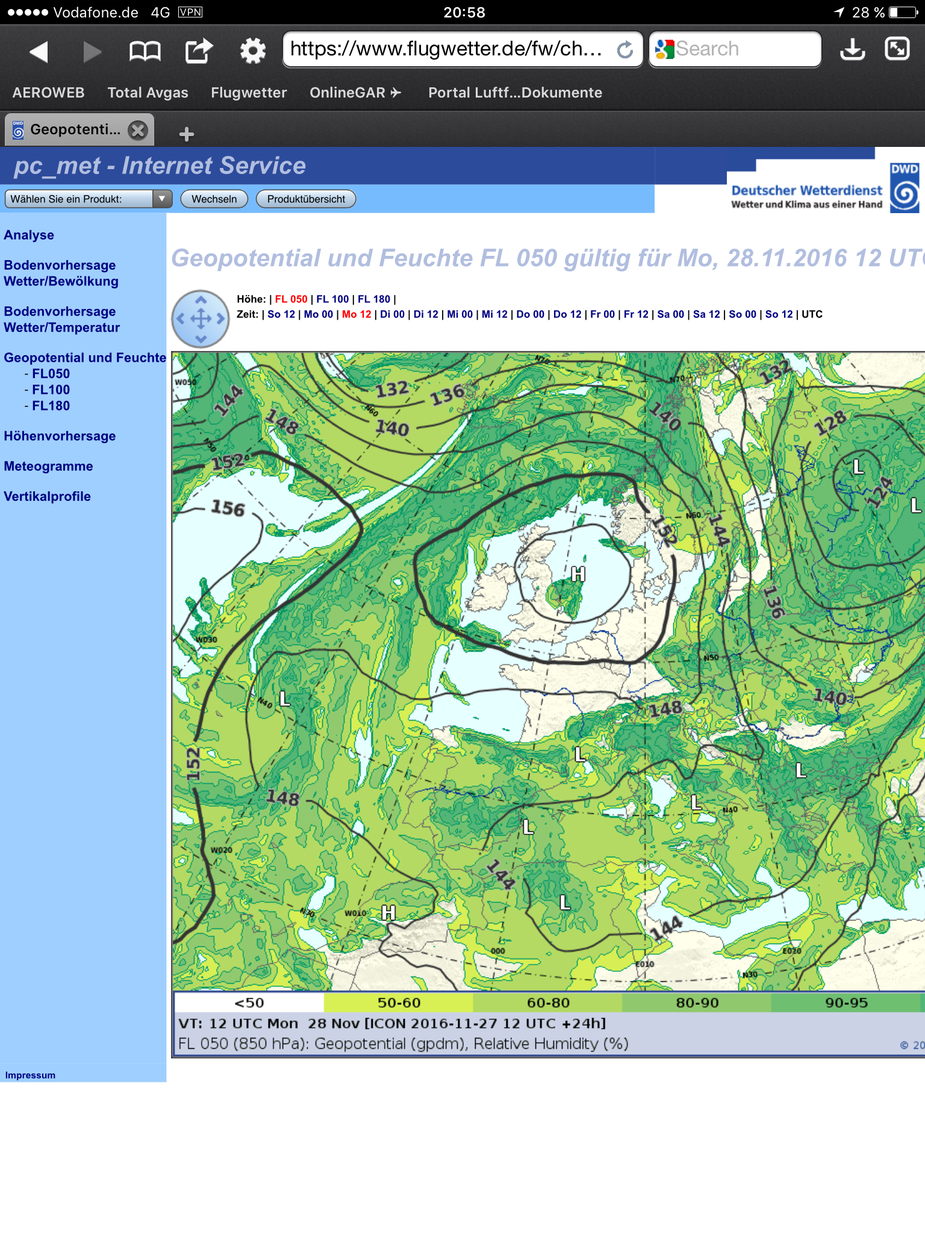
The “geopotential” should be the height above sea level of the 850 hPa (FL 50) pressure surface in 10’s of metres. Charts depicting the weather situation at altitude uses fixed pressure surfaces rather than fixed altitude surfaces, so the curves on the charts (the name escapes me) show the altitude of the pressure surface and serve the same purpose as isobars of a surface chart.
Relative humidity should give a clue about cloud amount.
Where the RH reaches 100% you should expect solid IMC. That you can be 100% certain of 
The problem is that this data will be only as good as what goes into the model and how good the model is. The world is full of websites which generate fancy graphics.
This is on a subscription site, no?
This is on a subscription site, no?
Yes, on the DWD weather site for aviation.
Relative humidity should give a clue about cloud amount.
But to be honest I can’t see too much additional benefit by this chart for flightplannig, beside the 100% IMC information @Peter mentioned.
I think the benefit of this site is that it comes from a supposedly good European wx model, rather than the US GFS model which 99% of free wx websites use.
GFS has been much improved recently but I am not sure how many of the free wx websites use the new data because the data is much bigger. Maybe @tomjnx knows?
I think the benefit of this site is that it comes from a supposedly good European wx model, rather than the US GFS model which 99% of free wx websites use.
There is no question about the site in general. I do always compare the different models before heading off for a flight in a difficult weather situation. My original question was only related to this single chart. Because maybe a proper use of this chart might increase my weather planning capabilities.