This was today, and it shows how above-standard warm air can make you think there is little or nothing there
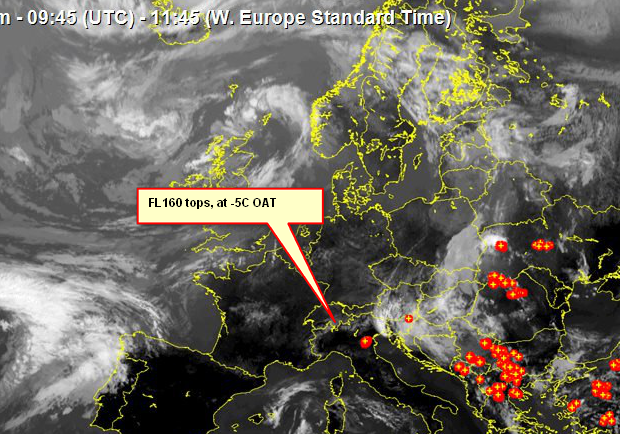
This is what the stuff actually looked like, at FL160
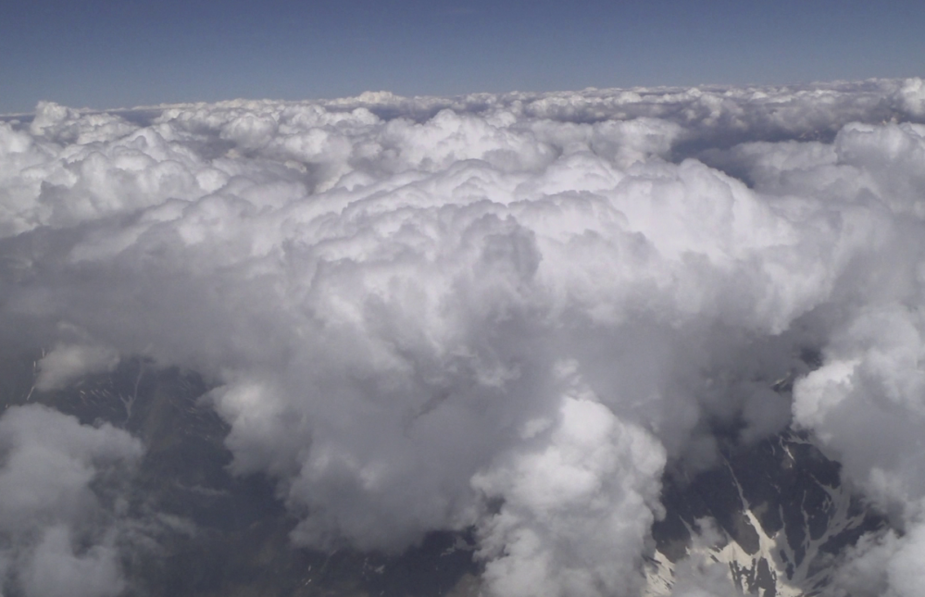
At -5C you can be very sure of collecting ice, especially rapidly when flying in the upper layers of this stuff.
On top of this, a plane flying at FL160 and -5C (ISA+12) doesn’t want to climb much higher, unless turbo charged. Yet this is the scenario most of us face during much of our flying, since it takes place in the summer, when the atmosphere is generally above standard.
Another thing you find is that the tops rise through the day, at quite possibly a few tens of feet per minute or more.
Do you mean this
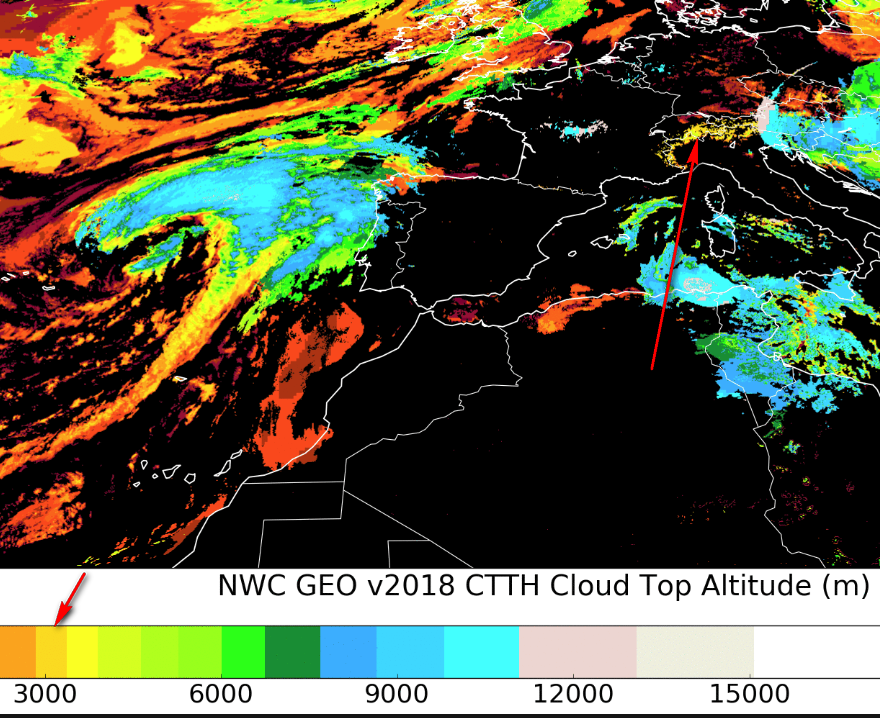
Yes that appears to be pretty good.
Is there any documentation on how they do the correction? ISA profile, or a “real” temp profile?
Yea the bit right where the arrow points to seems to be half way between yellow and green which is about 4500 m.
There’s loads of documentation on the website but I haven’t read through it. I’m sure the correction method they use is there somewhere.
But be careful. If the clouds – in this case fair weather cumulus – are scattered the signal comes partly from the ground which in turn “lowers” the tops
Well, after all the years we still don’t have a real actual cloud tops site…
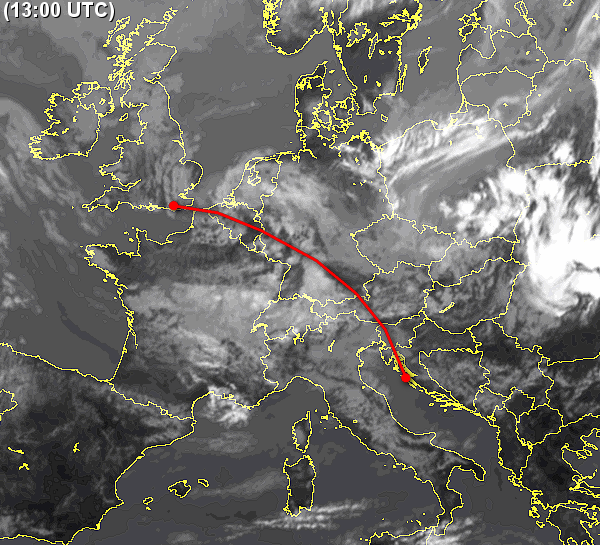
I cancelled this flight today because the IR image suggested tops FL180+ and windy.com reckoned something similar. And obviously a preflight IR image tells you just that; the tops grow over time as the air warms up, at quite a rate like 50-100fpm in some non convective cases.
There probably are some of the old tops sites but none of them did a correction for the actual (or even forecast) temps aloft. They just used the ISA gradient to convert the EUMETSAT shade of grey (which does give a fairly accurate temperature) to altitude.
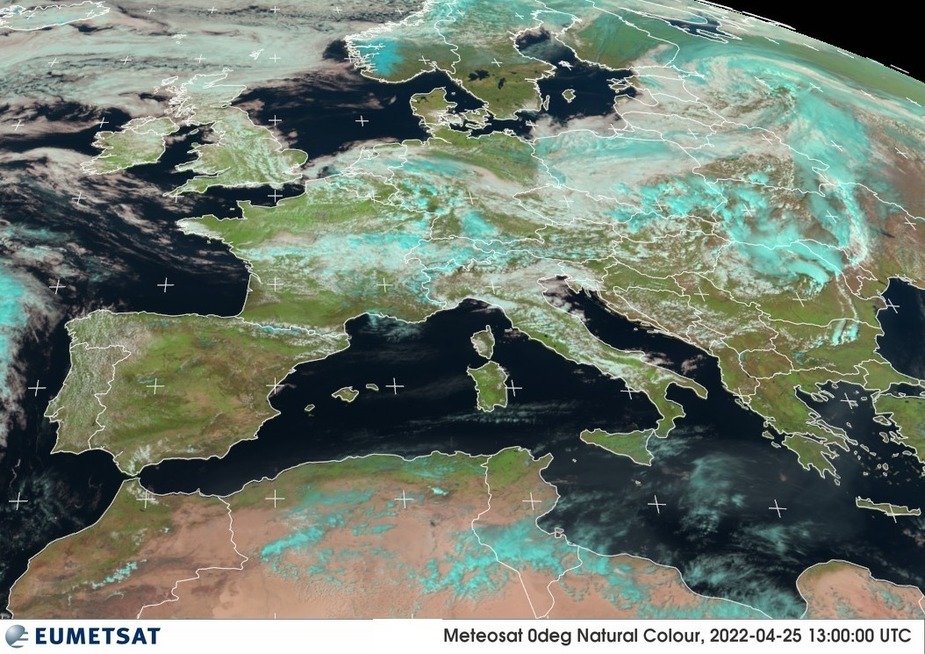
Do you ever use the RGB Composites? Do you find them useful?
Clouds containing water droplets are white while the clouds made up of snow/ice which are colder (and generally higher) are coloured cyan.
I don’t normally have to worry about cloud tops, but I do find these charts have to visually impart the sence of height of the clouds better than the IR or visible images.
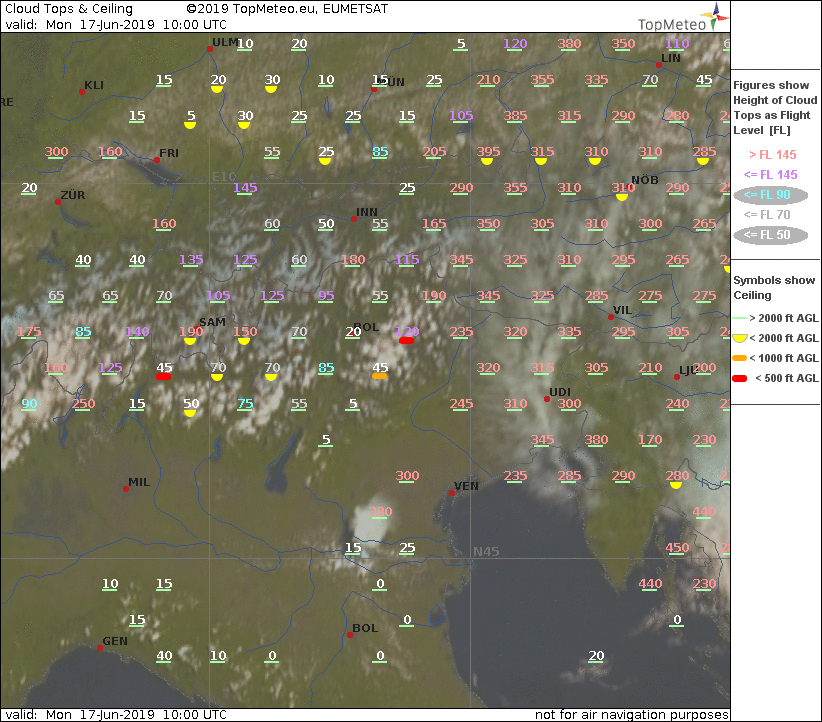
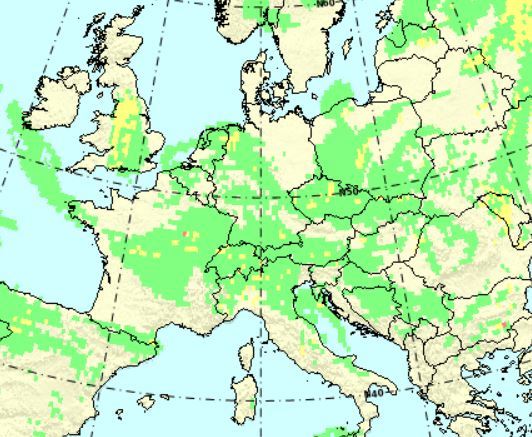
FL100 shows this light to moderate:
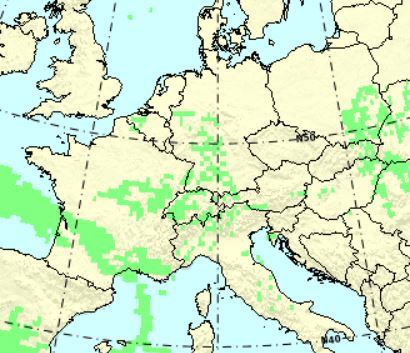
With a Turbo FL180 less :-)
How about using the T-Skew diagrams ?