Does anyone know the actual process? AFAIK the fronts are all hand-drawn. But where is the data coming from? The ground observations are sparse these days. It is done from satellite imagery?
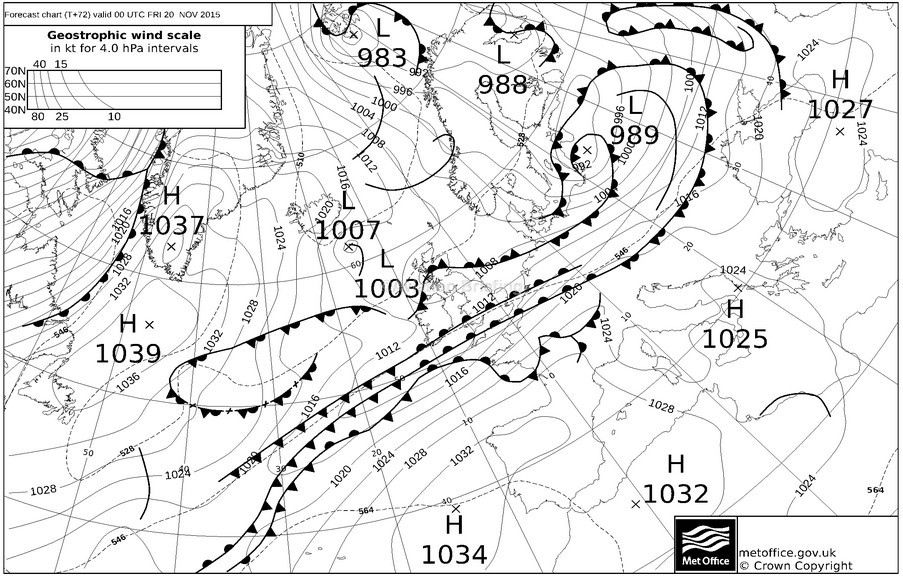
How can those closely spaced fronts over the UK be meaningfully generated?
Good question about frontal spacing. As an example between N50 and W10-20. How do the determine frontal passage in the classical sense when it is dependent on Wind and Temp. change with a spacing of what 300NM between 3 frontal boundaries?
The data come from:
- Satellites
- fixed ground stations
- ships
- ocean data buoys
- radiosondes
They are all put into the supercomputers and the outputs of the model are assessed by forecasters and the most likely one used to generate forecasts. The resolution of the model is very good over land, but not so good at sea.
I had a really fascinating chat with a Met Office forecaster at the London Boat Show last year that I learned a lot from about how they develop the forecast from the models.
So why can’t they give forecasts that agree?
I am looking at forecasts for today in the South of England. I received a Met Office warning yesterday for today forecasting winds at the airport of 20-22 knots gusting 28 to 32 knots. BBC forecast for the same location warns of 52 mph gusts and the weather warnings give 50-60 mph gusts.
Current TAF is 15kts gusting 25 kts with a prob 30 of 25kt gusting 35 kts. Current METAR is 25kts gusting 40 kts.
Even with the super computers, it is still a very inexact science.
All agree that it’s going to be windy 
TAFs are the best, they use local human knowledge on top of the computer models.