I wouldn’t let that stand as a blanket statement like this. If you “look past” the immediate output of some weather model, you can see what’s behind it – i.e. air masses and fronts. You can figure out where they are, how they move (in Europe, generally from west to east) and then work out a probability for the current situation being stable or not. In some cases, it will be impossible to predict what the weather will be in three days for VFR, in other cases you will be able to tell with almost 100 % certainty already 3 days ahead that you will be able or not be able to go.
I have to say I agree with Peter in general but you also make a fair point. There are times the two or three day prediction has a pretty good chance of being correct. However, for VFR regardless of all the fore planning, as a rule of thumb there is a good chance on the day what you thought would be good enough for VFR simply isnt. That is why I offered by all means plan and by all means use the techniques suggested on this thread but do you prep. thoroughly on the day with TAFS, METARS and area forecasts and ultimately rely on these however much your planning might have suggested the trip will be fine.
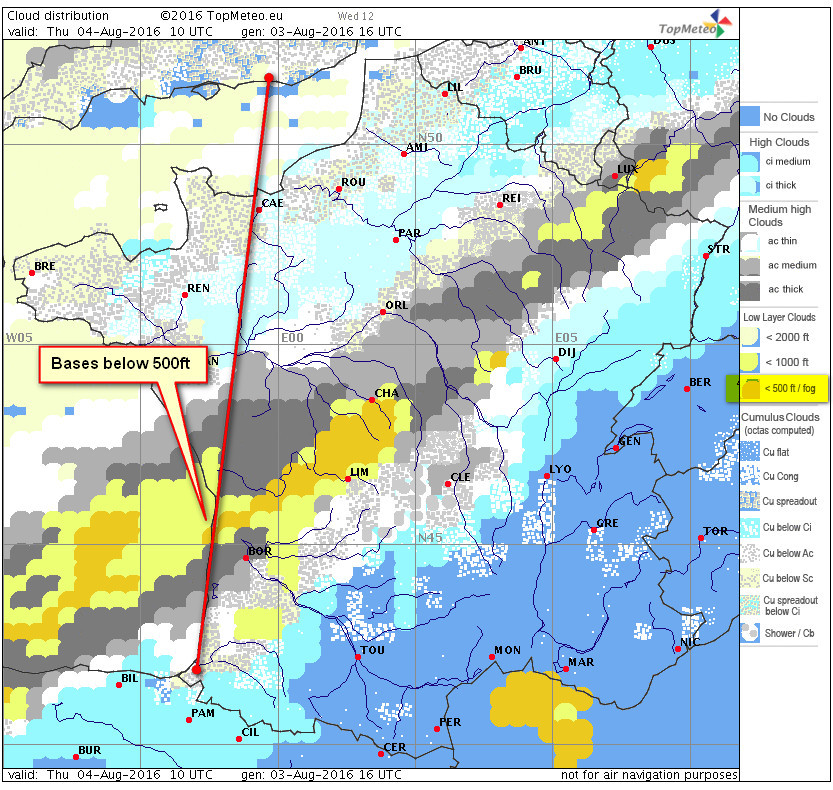
I would also suggest to sign up with topmeteo.eu, I use them together with the German DWD pcmet site; for Thursday before noon there seems to be fog and ceilings below 500ft in the western/ coastal region of Portugal, so from the current picture my impression is it looks like you might have difficulties to get out. Friday looks better.
topmeteo (at least they claim that) is done by pilots for pilots, taking flying into consideration more than other sites, where you have meteorologists sitting in offices who know zip about flying (with exceptions of course). I must say, I generally don’t expect much from any model more than 3 days in advance.
Having said that, you can get a pretty good picture by looking at several sites in parallel. For a long term first picture (to get a general impression what I can expect) I first go to the German DWD pcmet site and look at the overall weather situation on the ground chart, I think it a 10 day forecast, together with the charts for FL180 and above. Sometimes I go i.e. to Kachelmannwetter.com, where they have a 10-day comparison chart of all internationally available weather model forecasts there are, for a specific location, for a wide geographical range. I choose the locations I fly over. If all these models show me bad weather for the day of my flight, I am able to manage expectations better, warning passengers that the flight might not work.
4-3 days before I then go to the specific charts. Pretty soon you get the general picture. The cross profiles are one piece of the puzzle but unfortunately I have found that they don’t really show the situation as it is. better are the meteograms, these charts who look like a cut master for a Taylor’s shop.
RW20 did a very good profile here with Topmeteo.
But as the others said as well, it all might still change and so the TAF and METARS on the morning of the flight are usually the best source. Along with webcam views of the respective airports, as I have found out.
So, am I reading it correctly that for 10Z (and basically 14Z too) they are forecasting bases below 500ft
The MSLP chart I had in front of me when I posted your “challenge” was this
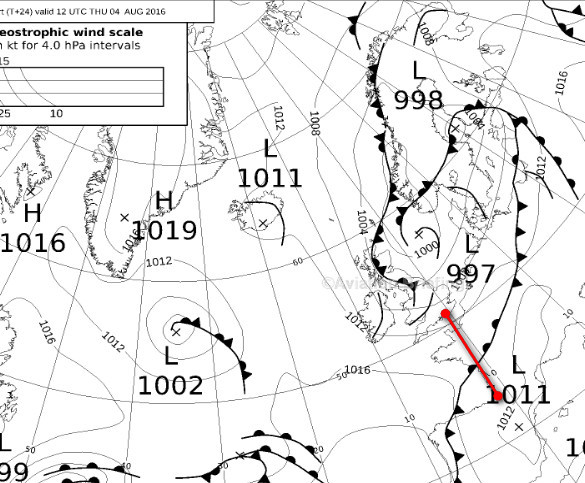
which shows a warm front right there.
The metars and tafs agree
LFBH 040530Z AUTO 35008KT 320V030 9999 -RA FEW033/// OVC058/// ///TCU 16/16 Q1014 BECMG 4000 -RA OVC003 OVC015
LFBH 040500Z 0406/0506 35010KT 4000 -RA OVC003 OVC015 BECMG 0411/0413 29010KT 9999 NSW BKN012 BECMG 0413/0415 BKN020 PROB30 TEMPO 0415/0421 4000 -SHRA BKN015TCU TEMPO 0421/0506 CAVOK
Moreover, the transition from the warm to the cold front

usually means a TS, and sure enough we have the “TCU” in the above tafs and metars.
The problem: Here, the Topmeteo forecast is not telling me anything that isn’t blindingly obvious from the MSLP. I have never seen a warm front which didn’t give sub-VFR cloudbases. And this is the biggest issue I find with longer range (i.e. GFS based, in Europe, being the only free wx 3D data) forecasts.
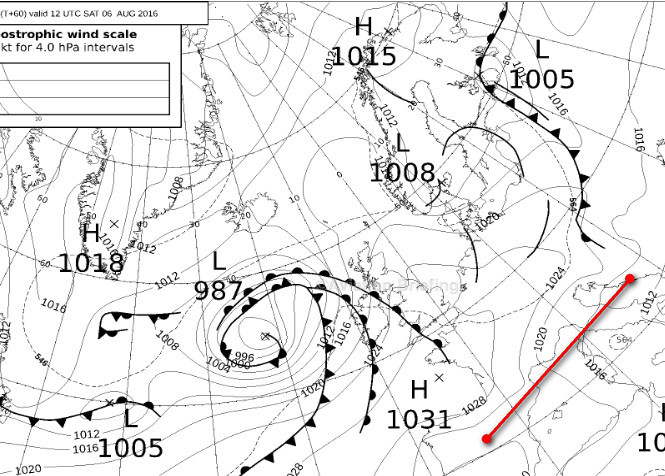
Let’s take a more difficult scenario. No fronts forecast at all on this route. Take Salamanca LESA to Split LDSP, Saturday 6th August 12Z
Peter wrote:
LFBH 040530Z AUTO 35008KT 320V030 9999 -RA FEW033/// OVC058/// ///TCU 16/16 Q1014 BECMG 4000 -RA OVC003 OVC015
Peter wrote:
Moreover, the transition from the warm to the cold front usually means a TS, and sure enough we have the “TCU” in the above tafs and metars.
I would be careful with AUTO METARs; cloud detection comes with many warnings on the box. Now, the METAR is:
LFBH AUTO 07006KT 9999 -RA NSC 16/16 Q1015 TEMPO 4000 RA BKN005 OVC015 BECMG 35010KT
I don’t see any more TCUs or CBs on the route (verified in a route briefing on Météo France, but I don’t know how to post a PDF here).
So I would say it’s not convective. Confirmed by the strike image (even though they love strikes in France):

There are only a few strikes on the eastern part of the massif central, as forecast yesterday.
Peter wrote:
The problem: Here, the Topmeteo forecast is not telling me anything that isn’t blindingly obvious from the MSLP. I have never seen a warm front which didn’t give sub-VFR cloudbases.
Actually, would you have guessed that it would be marginally possible to sneak around the east, as I have detailed in my analysis above? On your MSLP chart, it’s the same front, so how would you have guessed that even with the rising terrain towards the massif central, there may be a gap? Here are the cloud bases/tops:

So we do see the “corridor” with cloud bases of > 2000 ft just to the east of Châteauroux. Actually now just 15 minutes later, the bases have come down to 1000 ft already, so it probably wouldn’t feel very comfortable:

Peter wrote:
Let’s take a more difficult scenario. No fronts forecast at all on this route. Take Salamanca LESA to Split LDSP, Saturday 6th August 12Z
I’ll do that when I come back from a run.
All the models have a grid size, and the smaller the grid size is, and the more horizontal layers it has, the less inaccurate the forecasts will be, in other words, the higher the confidence level will be for a certain forecast for a specific location and time, and of course, the forecast grid size will be driven by the input grid size. All models run through multiple calculations where the current weather acts as input data, then you have calculation # 1, whose output then acts as input for calc. #2, and so on. I attended a seminar of the German weather service a 3 months ago, where they explained all the models and differencies. Key result that I took with me was, most models can give us more or less reliable forecasts for a maximum of 3 days, and the differences are then in the size of the forecast region, and the confidence level you have. GFS for example is not bad at all, it has a 40km grid, which is obviously less accurate for a 3-day forecast for a specific location then, say, a model with a 15km grid. And some weather services might have decided not to show the forecast for a location, simply because they don’t feel the confidence level is high enough.
If I compare a 3-day forecast in Topmeteo and the DWD, for example, they don’t contradict each other. They just add up to a general picture.
I don’t know how to post a PDF here
I sometimes do but I upload them to my own ftp site. I can do that for yours. Otherwise, I do a screenshot using Faststone Screen Capture (I posted about this great prog in the IT section).
Actually, would you have guessed that it would be marginally possible to sneak around the east,
I do not believe that cloudbases can be forecast to anywhere remotely near that degree of resolution. (depends how far east – the warm front ends mid-France and then changes to a cold one, where higher bases can be expected).
You often see this in wx models. I spent years looking at Meteoblue. Impressive graphics and frequently one would see a great route through some wx, at some level, between layers… unfortunately it was usually fiction – except when it came true by luck and then one felt really good about it. Meteoblue was a PhD project which took GFS and did some extras on top of it. It was also crippled by crappy Java (client side!) programming.
The nature of frontal wx is that you get different bits in different places. I often walk in the countryside (most days, up on the hills) and this is very visible. But nobody can forecast it. The best thing is tafs and metars around the place, just before the flight.
VFR is really difficult in frontal conditions, especially warm fronts which tend to give OVC005-007 kind of wx.
On top is often possible, airspace and ATC permitting, but usually only enroute. I used to do that a lot.
All the models have a grid size, and the smaller the grid size is, and the more horizontal layers it has, the less inaccurate the forecasts will be, in other words, the higher the confidence level will be for a certain forecast for a specific location and time, and of course, the forecast grid size will be driven by the input grid size.
I think the “input grid size” i.e. what data you feed in, is the limiting factor these days. They get the baloons twice a day but only in a few places in Europe. Then they get metars from airports. But the is no reason to suppose they will ever get to the point of forecasting OVC005 in one place (of a warm front) and OVC008 in another place along the front, 20-50nm away.
Peter wrote:
I think the “input grid size” i.e. what data you feed in, is the limiting factor these days. They get the baloons twice a day but only in a few places in Europe. Then they get metars from airports. But the is no reason to suppose they will ever get to the point of forecasting OVC005 in one place (of a warm front) and OVC008 in another place along the front, 20-50nm away.
True. Same reason for them not being able to tell us where a thunderstorm will come down, to help avoid flooding damages. This is microweather, and that would require input data on a 1-2km grid size and much, much more computing power.
The other thing the guy told us was that even if we have pretty precise picture for a vertical grid, predicting the tops and ceilings is much more difficult and unprecise. No model, currently, is able to predict the tops with anything remotely usable for VFR flying.
I reckon they already have the tops, to within say 1000ft.
They get the IR temperature from satellite images. In Europe EUMETSAT has AFAIK the monopoly on hi-res thermal IR images and the sensors on that are going to be very accurate. Even industrial handheld IR thermometers are good to 1C nowadays, on a good day.
Then you need temperatures aloft, for calibrating the image temperature. Someone here reported that Lufthansa sends back the OAT readings from all its airliners. This will yield data from high altitudes mostly, but there are plenty of terminal areas at airports which they fly to. And GFS forecasts of temps aloft are actually fairly accurate – within say 2C (i.e. worth 1000ft) at FL150.
But there is no current website which applies the real (ok; ex-GFS-forecast) temp profile to the EUMETSAT images. There’s a nice project! 
Off topic for the Portugal-Spanish flight though…
Rwy20 wrote:
You could also have a look at Météo France’s TEMSI EUROC (EURope OCcidentale) chart, which is produced about half a day in advance. It covers your route and will show the predicted cloud types, cloud bases and cloud tops as well as predicted significant weather. You can sign up for free here (by choosing a password of at least 8 characters, with at least one uppercase letter and at least one number – like someone is that desparately going to want to hack into my free, read-only account):https://aviation.meteo.fr/login.php
Example:
To complete all these sources, you could have a look at this site, but maybe you know it :
http://ama.aemet.es
this is the spanish aeronautical met site, with more detailed chart of significant weather :
!! 
Bear in mind that, as of a few years ago, ICAO compliant SigWx charts suppress all other wx info for regions in which CBs are forecast (or something similar).
A short time before that, they supressed the depiction of fronts…
These charts are for jet operators.