Peter wrote:
very few locations in Europe (and none in France are publishing to the US which is the only free source AFAIK)
DWD has a site which includes most European Soundings, more than Wyoming anyway. Also the French ones if I am not mistaken.
https://www.dwd.de/DE/leistungen/hobbymet_hw_europa/hobbyhoehenwettereuropa.html?nn=452870
Meteo Swiss publishes some for free as well.
https://www.meteoswiss.admin.ch/home/measurement-and-forecasting-systems/atmosphere/radio-soundings.html
You can get the Payerne Sounding alone or mixed with Stuttgart, Milan and Munich.
The French ones can be downloaded via this site (but are available via DWD as well, see above.
https://donneespubliques.meteofrance.fr/?fond=produit&id_produit=97&id_rubrique=33
Go “Telecharger” and select the date/station e.t.c. and PDF.
Peter wrote:
only taken 0000Z and 1200Z
True but you can still see the tendency for convection and the general state of the athmosphere. As I said, there are quite a few good webinars and pdfs to explain those things. Issues such as trigger temps for convection e.t.c. don’t need much larger resolution.
Even if you use forecast soundings (which are exactly the same display but generated by models, the technique is the same. And obviously they are forecasts whose quality depends on the model. However, if you look at the model sounding rather than say a vertical profiles generated out of them, you basically see the source for those rather than the finished product which are often dumbed down. It’s a bit like reading a METAR or TAF rather than the translated versions some tools provide.
There are a few issues with these
Otherwise, if you could get a good one for anytime anywhere, the atmosphere would have no secrets 
igor wrote:
Is it worth learning to interpret SkewT diagrams, considering that we have a vertical cut from the Autorouter & Windy? Do you find SkewT data is more accurate in some way or maybe it provides an additional info that’s not on Windy or Router?
As someone who lives with the things day by day I’d say absolutely yes.
Again, the valuable data is the actual soundings, not the forecasts. You can do quite amazing things with those. But primarily, what they do is give you a quite accurate and detailed look at the atmosphere as it is at that point. Up to today, there is no more reliable way to do that.
There are many good videos and documents about how to read one and what to take from them. For me for starters, the most interesting bit is to figure out the trigger temperatures for convective buildups, apart of course from reading out cloud layers e.t.c.
Don’t forget: All the vertical profiles you see in the models are de facto derived from soundings and some other stuff, so the actual sounding is the real thing. Being able to read at least the gist of a sounding and it’s Skew/T is basic meteorological knowledge.
OK; found it
On a skew-t, the cloud layers are obvious. What is less obvious are things like the lapse rates, which determine how convective the airmass will be. I never learnt that stuff. But that should be reflected in the other data displayed e.g. the rain/thunder layer.
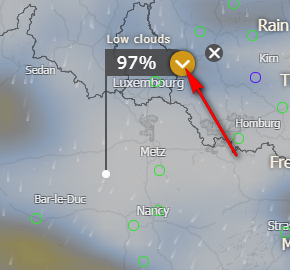
Windy.com also displays actual baloon data (“sondes”).
But, when i had a look just now, I can’t make it work.
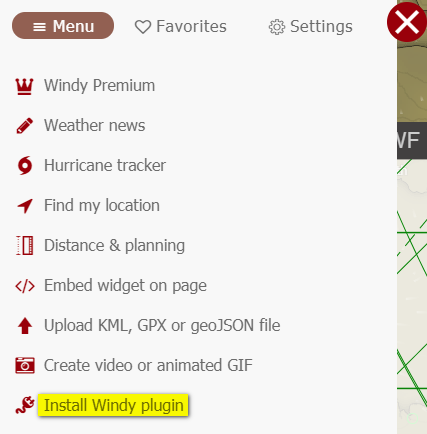
It’s in the plugins section.
So, basically windy has the same data in graphical format (different layers and meteogram) as the SkewT?
I don’t think it is worth putting a lot of time into it, because the forecast skew-t diagrams come out of the same 3D model which is used to generate everything else, on say windy.com.
Reading back up this 2 years old thread, one thing which has changed is that windy.com now offers skew-t diagrams too, from ECMWF. But, when i had a look just now, I can’t make it work. This is where it was accessed:
Is it worth learning to interpret SkewT diagrams, considering that we have a vertical cut from the Autorouter & Windy? Do you find SkewT data is more accurate in some way or maybe it provides an additional info that’s not on Windy or Router?
Supersonic wrote:
Right-click on any place on rhe map and then the last option („Aerologie“ in German).
Wow. That is really impressive.
Peter wrote:
One issue with GFS is the update frequency. I am not sure what it is now but it used to be every 12hrs or so and thus you could be using quite old data.
Two times a day is more than enough for a model with this resolution. GFS works very well considering what it is, but it is NOT a high resolution model and never was intended to be one.
wbardorf wrote:
). I assume USAF use GFS whilst EDDF are based on ICON unless USAF have developed their own proprietary forecast.
I am not sure what they use but it is a good guess that the DWD will use ICON, the USAF will use whatever they have and they do have more than GFS. However, TAF’s get (to this point at least) written by humans so their experience and knowledge have a very large part to do with the final product. The base for a TAF are the last couple of METARS and you take it from there. Models are part of that process, but not only. One bit how you can do that (not necessarily how they do that but a good guess would be they also work along these lines) is that you look at all the available models and compare the results, then check other possible means such as ensemble forecasts e.t.c. and combine all that with what you know about each model and the local climate.
We also have a saying that St. Peter (who according to some is responsible for the weather) does either not know the models or has a field day making fun of them. Or a bit more serious, the weather does not follow anyones schedule. Model runs even of the most recent and most advanced models can go from sunny to pear shaped in 2-3 runs.
GFS may have one factor in built as it is worldwide and that is that it may be a bit more sluggish than the high res models, which can be a benefit in some scenarios and a problem in others. While ICON and other high res models sometimes are a bit jumpy in certain conditions, GFS may appear more stable as it does not have all the influences high res models take into account.
Peter wrote:
I find the ECMWF data (as on windy.com) to be much better than GFS for the 2-5 days ahead scenario.
For flight planning purposes, anything but the last one or two runs (depending on the update frequency) has anything to do with the truth, everything before is a guess at most. A front is considered to be “on time” if it arrives over a position within 6-12 hours of when it has been forecast 24 hours before… so imagine what kind of impact that has. Also, the longer a model calculates ahead, the more extremes become extremer. (Not unlike certain climate models who regularly predict the end of the world btw).
My pet peeve at my day job are folks who check their Weather Pro or other automated 10-30 day forecasts and start needling us why the weather did not comply. For me, while weather pro and other such sites can give a very educated first hunch and can be surprisingly accurate in stable conditions, basing your lunch on them can keep you hungry more often than you care for.
24 hours ahead I’d say 80-90% accuracy, 48 hours 60-70% and everything beyond that needs a good meteorologist to make head or toe of. Particularly when it comes to extremes.
wbardorf wrote:
Whenever I fly into Egelsbach, I have the choice to use EDDF or ETOU (Wiesbaden USAF base) TAFS as both airports are reasonably close to each other and they are often very different. In many cases I have found the ETOU TAF to be more accurate (sometimes I look at the EDDF forecast and think it is overly optimistic). I assume USAF use GFS whilst EDDF are based on ICON unless USAF have developed their own proprietary forecast.
In Sweden at least, TAFs for military airports are made by on-site meteorologists while TAFs for other airports are not. That can make quite a difference for the accuracy in favour of military TAFs.