
I just wanted to say thanks. I downloaded this yesterday. Weather is generally the number one factor in go / no go decisions so any info is good.
Personally I find a good decisionmaker for "high altitude" IFR flying 
http://peter-ftp.co.uk/screenshots/2018-07-17_185636.jpg
One thing I have found particularly interesting is how a transition from a warm front to a cold front, along the same "line", is so often a location for a big TS. I am sure there is a reason...
One thing I have found particularly interesting is how a transition from a warm front to a cold front, along the same "line", is so often a location for a big TS. I am sure there is a reason...
If I remember my met lessons correctly, that is where you most likely to find the end of a TROWAL
In terms my brain can understand, it is the point where warm moist air at the surface is most nearly surrounded by cold air trying to get under it. So you get lots of convection.
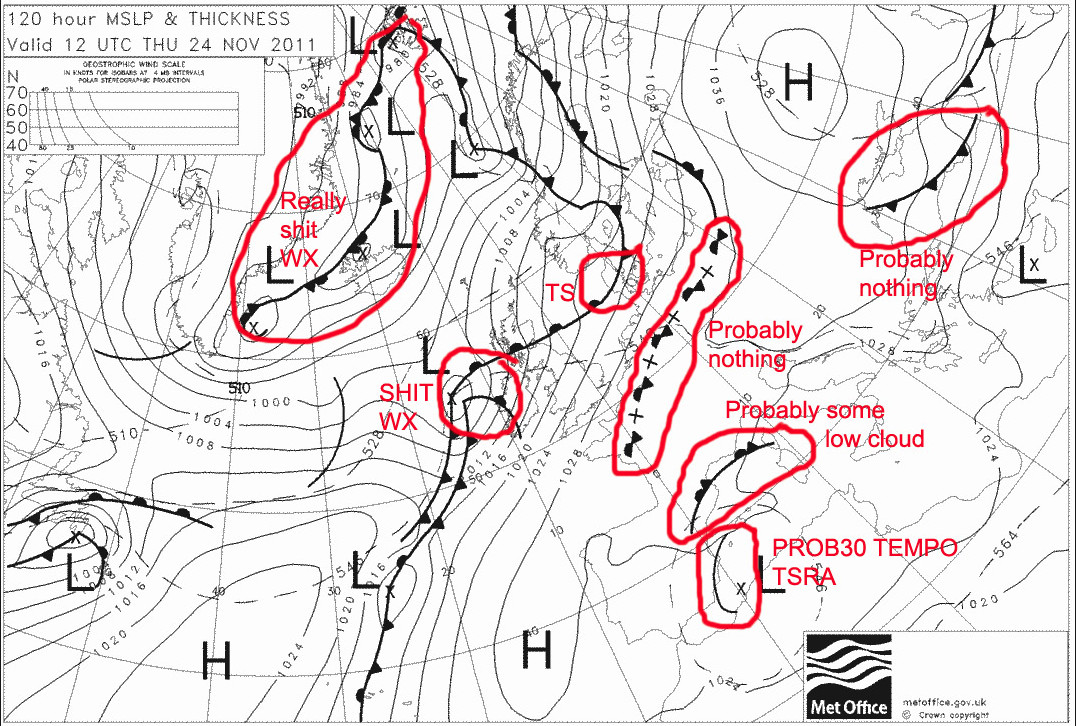
Couldn't find the code for really shit weather.....
Does anybody use the "trial"mesoscale simulation on the UK Met site? It is interesting but I sometimes find it difficult to correlate the text description of the colour coding with the plot....eg right now there are blotches of white shown for which there is no corresponding description...or is it just me? :)
I think the white is really meant to be light grey.
There are a number of weather fact sheets on the Met Offices website
Number 1 Clouds
Number 2 Thunderstorms ? Number 3 Water in the Atmosphere ? Number 4 Climate of the British Isles ? Number 5 White Christmases ? Number 6 Beaufort Scale ? Number 7 Climate of Southwest England ? Number 8 The Shipping Forecast ? Number 9 Weather Extremes ? Number 10 Air Masses and Weather Fronts ? Number 11 Interpreting Weather Charts ? Number 12 National Meteorological Archive ? Number 13 Upper Air Observations and the Tephigram ? Number 14 Microclimates ? Number 15 Weather Radar ? Number 16 World Climates ? Number 17 Weather observations


