I don’t think it is worth putting a lot of time into it, because the forecast skew-t diagrams come out of the same 3D model which is used to generate everything else, on say windy.com.
Reading back up this 2 years old thread, one thing which has changed is that windy.com now offers skew-t diagrams too, from ECMWF. But, when i had a look just now, I can’t make it work. This is where it was accessed:
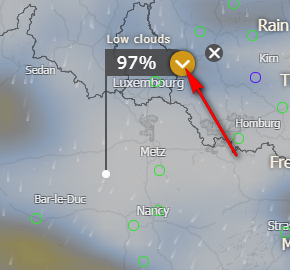
But, when i had a look just now, I can’t make it work.
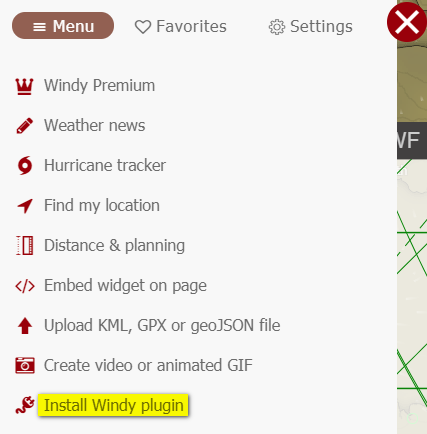
It’s in the plugins section.
So, basically windy has the same data in graphical format (different layers and meteogram) as the SkewT?
OK; found it
On a skew-t, the cloud layers are obvious. What is less obvious are things like the lapse rates, which determine how convective the airmass will be. I never learnt that stuff. But that should be reflected in the other data displayed e.g. the rain/thunder layer.
Windy.com also displays actual baloon data (“sondes”).
igor wrote:
Is it worth learning to interpret SkewT diagrams, considering that we have a vertical cut from the Autorouter & Windy? Do you find SkewT data is more accurate in some way or maybe it provides an additional info that’s not on Windy or Router?
As someone who lives with the things day by day I’d say absolutely yes.
Again, the valuable data is the actual soundings, not the forecasts. You can do quite amazing things with those. But primarily, what they do is give you a quite accurate and detailed look at the atmosphere as it is at that point. Up to today, there is no more reliable way to do that.
There are many good videos and documents about how to read one and what to take from them. For me for starters, the most interesting bit is to figure out the trigger temperatures for convective buildups, apart of course from reading out cloud layers e.t.c.
Don’t forget: All the vertical profiles you see in the models are de facto derived from soundings and some other stuff, so the actual sounding is the real thing. Being able to read at least the gist of a sounding and it’s Skew/T is basic meteorological knowledge.
There are a few issues with these
Otherwise, if you could get a good one for anytime anywhere, the atmosphere would have no secrets 
Peter wrote:
very few locations in Europe (and none in France are publishing to the US which is the only free source AFAIK)
DWD has a site which includes most European Soundings, more than Wyoming anyway. Also the French ones if I am not mistaken.
https://www.dwd.de/DE/leistungen/hobbymet_hw_europa/hobbyhoehenwettereuropa.html?nn=452870
Meteo Swiss publishes some for free as well.
https://www.meteoswiss.admin.ch/home/measurement-and-forecasting-systems/atmosphere/radio-soundings.html
You can get the Payerne Sounding alone or mixed with Stuttgart, Milan and Munich.
The French ones can be downloaded via this site (but are available via DWD as well, see above.
https://donneespubliques.meteofrance.fr/?fond=produit&id_produit=97&id_rubrique=33
Go “Telecharger” and select the date/station e.t.c. and PDF.
Peter wrote:
only taken 0000Z and 1200Z
True but you can still see the tendency for convection and the general state of the athmosphere. As I said, there are quite a few good webinars and pdfs to explain those things. Issues such as trigger temps for convection e.t.c. don’t need much larger resolution.
Even if you use forecast soundings (which are exactly the same display but generated by models, the technique is the same. And obviously they are forecasts whose quality depends on the model. However, if you look at the model sounding rather than say a vertical profiles generated out of them, you basically see the source for those rather than the finished product which are often dumbed down. It’s a bit like reading a METAR or TAF rather than the translated versions some tools provide.