Narrative??? None is needed. From Cobalt’s link above:
The Apollo moon landings were faked, too.
Mooney_Driver wrote:
it is by no means a majority who does not want the measures, but a vocal minority of at best 30% of the general population depending on how the questions are set. So not a problem of majority issues, in most surveys 60-70% of those replying were asking for stronger measures
Mooney_Driver wrote:
Fact is, that many here refuse to be tested as they don’t want to be isolated
What a surprise – survey people as to if they think that the rules are good enough and they say “no, look at those idiots” yet actually impact someone personally and they dont want to follow the rules…
BeechBaby wrote:
Yes because it does not fit your narrative.
Doesn’t have to do with any kind of narrative – just stating that “0.02% of UK physicians say they would not take the vaccine immediately" would not make a good headline.
(And btw. it does fit “my” narrative").
BeechBaby wrote:
It may come as a shock to you but the world does have individuals that question, people that go against the grain, people that actually stand and have a different view and not spend their lives swimming with the populist tide.
It’s not a shock at all. We typically call these people “scientists” – if and only if they apply adequate diligence in doing that. The core challenge in that discussion is not opinion. The core challenge is that unfortunately many people can (or don’t want to) differentiate between topics where one should debate opinion and topics where there is no room for opinion because it is about facts.
There is no room for opinion on how many people are infected. There is no room for opinion if people actually die (and how many of them). There is no room for opinion if vaccination will help to save lives. That’s all facts one can either know or not know.
The playing field for opinion is where it comes to doing tradeoffs:
How much money are we willing to spend to save one life?
Are we willing to force people to wear mask in public to prevent them from killing other people or do we weight individual freedom higher than other people’s lives?
How much do we compromise on education for our children in exchange for slowing down the infections?
BeechBaby wrote:
sheeple
Do you think it is appropriate to refer to people as “sheeple” in a discussion? Really?
Sheeple are not what you may think

This is just in, our hospital administration now decided that all elective surgery that requires Intensive care capacity on standby has to be cancelled, at least until tuesday. They are probably waiting for the state administration to make a longer-term decision.
We had to postpone surgeries for several days in a row now, due to lack of ICU capacity.
Cobalt wrote:
Probably because (a) they are more at risk and (b) have less exposure to the social media traffic driving the anti vaccination moods.
Well, if you have nothing to lose …
Cobalt wrote:
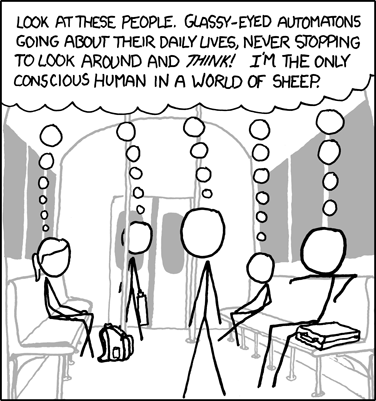
Sheeple are not what you may think
Could you explain that cartoon?
LeSving wrote:
Could you explain that cartoon?
I this context – trying to inject some light-heartedness in an otherwise depressing thread. As far as the cartoon is concerned, Somebody else can…
More fitting, maybe:
But that makes it serious again.
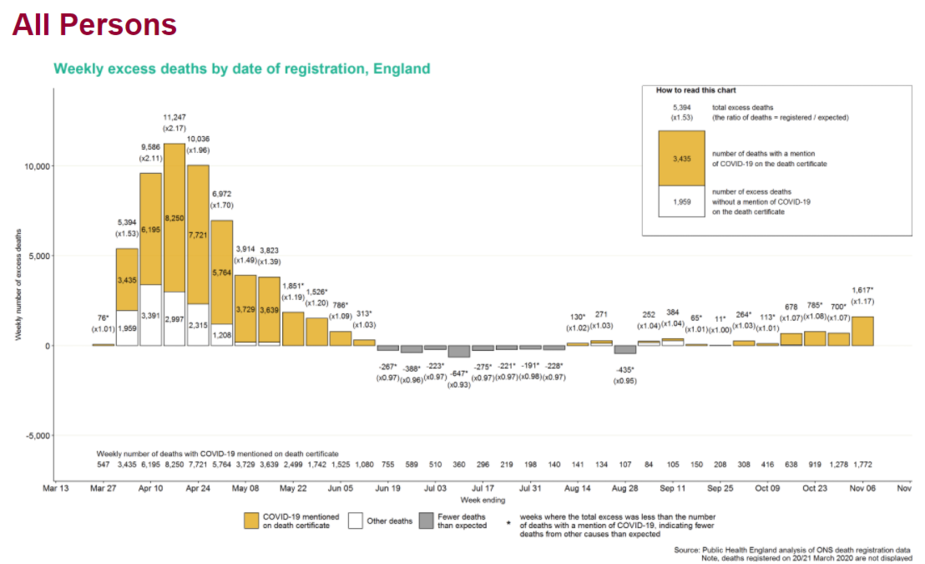
I had a look at some numbers.
Using these two sources:
COVID 19 total announced deaths 25 November 2020
and
Mid-2019: SAPE22DT6a edition of this dataset
I spent a little time with a spreadsheet and I compiled the table below.
Abbreviations:
CCG: Clinical Commisioning Group, i.e. NHS region
DiH: Deaths in hospital between the November dates quoted (inclusive).
Notes:
Deaths/Mio means 7-day deaths in hospital for 13-19 Nov inclusive.
Weekly growth means percentage increase in 7-day fatalities from 6-12 Nov to 13-19 Nov.
The two weeks cover the most recent ‘reliable’ data from the NHS England spreadsheet.
The second UK Lockdown started 5 Nov, so the infections which caused these deaths were mostly just before lockdown.
Region         Popn.    DiH    DiH  Deaths   Weekly
(CCG)         (,000)  06-12  13-19    /Mio   growth
------------  ------  -----  -----   -----   ------
London         9,862    111    149    16.6      34%
South East     8,898    129    149    16.7      16%
South West     5,631     76     99    17.6      30%
E of England   6,529    107    121    18.5      13%
Midlands      10,602    410    462    43.6      13%
NE & Yorks     8,603    460    478    55.6       4%
North West     7,061    497    470    66.6      -5%
------------  ------  -----  -----   -----   ------
Total/Avg     56,286  1,790  1,928    34.3       8%
A few points jumped out at me.
But I’m sure other interpretations are available :-)