I think Windy is great for general overview of actual weather (satellite/radar) situations, as well as for the same general weather “systems” predictions/forecasts.
Some wx patterns are just not possible to forecast. For example right now there is a huge pressure and the typical winter thin layer of cloud over a vast area, base 1000ft, tops 2000ft, and good luck trying to forecast where this will be present, or not. I was flying it today. Super scenic, you freeze your goolies off on SFC at +1C and it is +8C on top.
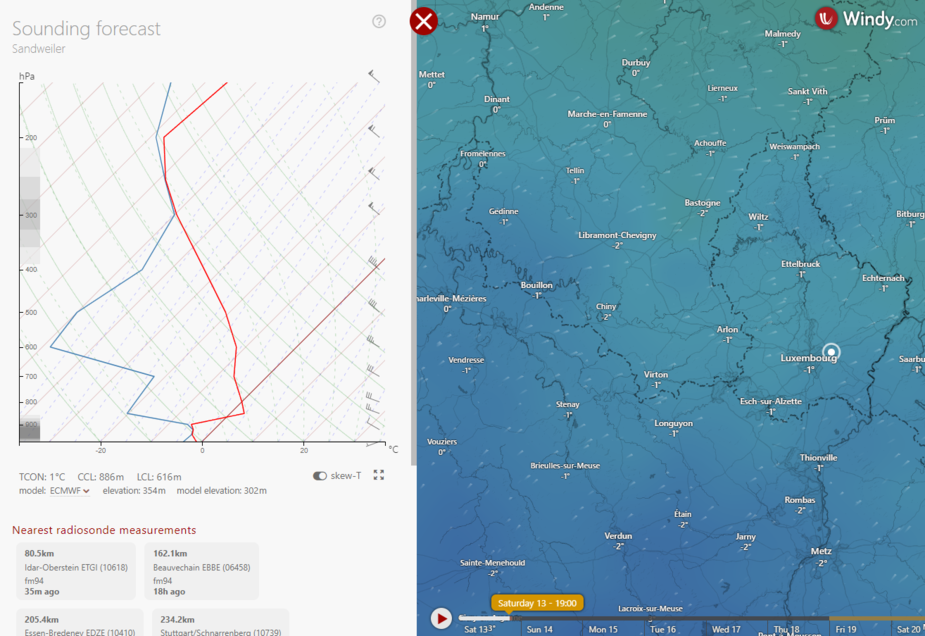
A sounding / skew-t / tephigram (all basically the same idea) are generated from the same 3D model as all the other stuff. There is no hidden magic. If the sounding says cloudbase will be 2000ft then selecting the cloudbase layer and clicking on different parts of it will also show 2000ft  I wrote about that here and we simply have access (FREE access) to better models than when I wrote that.
Peter wrote:
Some wx patterns are just not possible to forecast.
Absolutely, and very often not very accurately forecasted by Windy (and other application). For general area forecasts, sure it´s not bad at all.
We have nationally issued TAFs and METARs to presumably consider local phenomena’s – though these are definitely no as precise or skillfully produced as they used to be (TAFs that is! ;-) ).
hazek wrote:
Have you tried using that at all?
Sorry, I don´t understand the question @Hazek?
Peter wrote:
There is no hidden magic.
There is if you know how to read it.
hazek wrote:
Do you include the following tool in your analysis of the weather forecast?:
The “Sounding forecast” I have no clue what the hell that is?
The right hand photo simply seems to be the graphical wind/temperature forecast, and the left hand “Sounding forecast” is a temperature/wind chart.. I´m sorry, but I´m missing the point here it seems.
If the software is not easily “read” it will likely be dismissed by most users.
See my link
Also “Threads possibly related to this one” below, and Skew-T there.
There is if you know how to read it.
I could respond to that.
Yeager wrote:
If the software is not easily “read” it will likely be dismissed by most users.
Ah yeah you got me there, you do need to learn how to read this to make use of it. But being a pilot is not easily “learned” either so maybe better dismiss that as well yeah?
Peter wrote:
See my linkAlso “Threads possibly related to this one” below, and Skew-T there.
I could not respond to that.
hazek wrote:
Do you include the [sounding forecast] in your analysis of the weather forecast?:
Does that really add anything to the other tools that Windy provide? I mean, all the info about clouds that Windy provides must come from the sounding forecast.
It does. If you use it in conjunction with moving the timeline you can better understand the trend. You can better understand the chance for fog, and how thick the cloud layer will be, the ceilings, tops, cloud coverage, stability or instability of the atmosphere, etc.
@yeager wrote:
We have nationally issued TAFs and METARs to presumably consider local phenomena’s – though these are definitely no as precise or skillfully produced as they used to be (TAFs that is! ;-) ).
I presume you mean a deteriorating precision of TAFs in Portugal. What causes that? I haven’t noted it here.